Trend Function
- Trend Functions :
- Description of all Functions :
|
Sr No |
Command |
Icon |
Description |
|
1 |
Draw Trend |
|
Drawn the trend between start and end date. |
|
2 |
Online Trend |
|
Draw online trend(Live Trend). |
|
3 |
Clear All |
|
Clear all drawn trend |
|
4 |
Highlight |
|
Trend Highlighting ON and OFF |
|
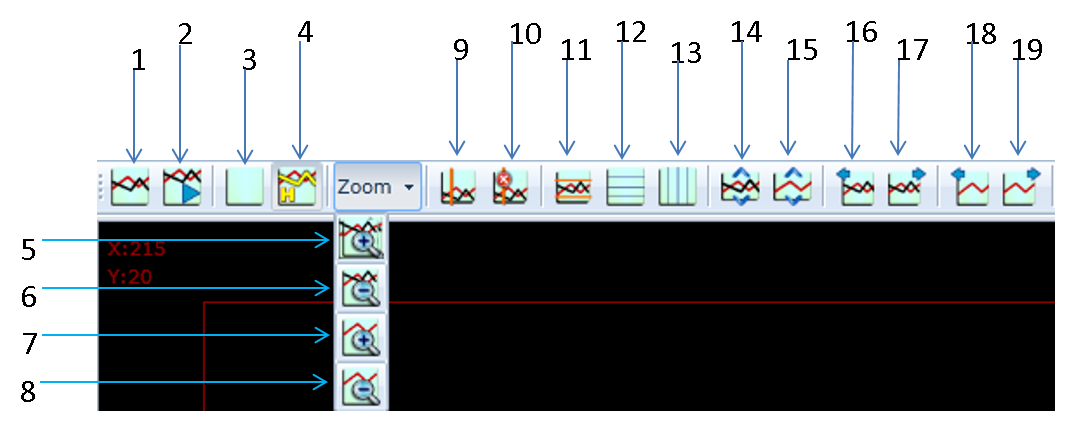
5 |
Zoom in All Tags |
|
Zoom in the all display trend |
|
6 |
Zoom out All Tags |
|
Zoom out the all display trend |
|
7 |
Zoom in Selected Tag |
|
Zoom in the just one selected trend |
|
8 |
Zoom out Selected Tag |
|
Zoom out the just one selected trend |
|
9 |
Vertical Slider |
|
You can check the value of Tag of particular time by moving vertical slider |
|
10 |
Remove Slider |
|
Remove all Slider |
|
11 |
Horizontal Slider |
|
You get two sliders for check the difference between maximum and minimum value of tag of particular time by moving horizontal slider. |
|
12 |
Horizontal Grid Line |
|
Show horizontal grid line. |
|
13 |
Vertical Grid Line |
|
Show vertical grid line. |
|
14 |
Auto Scaling of all Tag |
|
This function take minimum value of corresponding Tag then auto scale the trend. |
|
15 |
Auto Scaling of Selected Tag |
|
Only selected tag will auto scale. |
|
16 |
Drawn Trend Shift Left side |
|
Shift all drawn trend left side. |
|
17 |
Drawn Trend Shift right side |
|
Shift all drawn trend right side. |
|
18 |
Select Tag Shift left side |
|
Shift selected drawn trend left side. |
|
19 |
Select Tag Shift right side |
|
Shift selected drawn trend right side. |


|
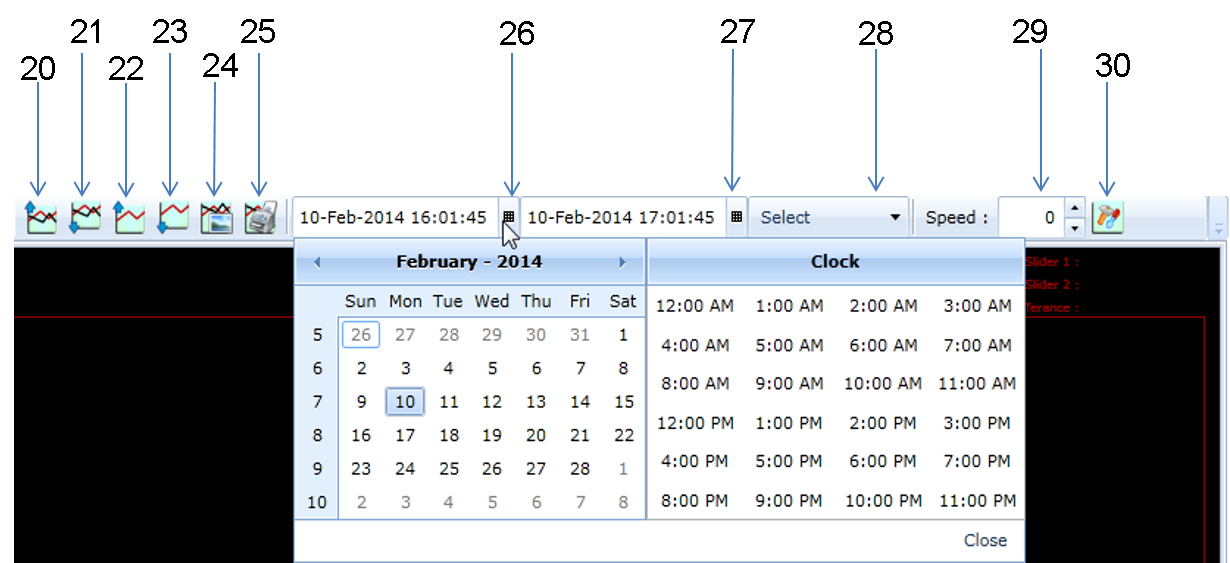
20 |
Drawn Trend Shift up side |
|
Shift all drawn trend up side. |
|
21 |
Drawn Trend Shift down side |
|
Shift all drawn trend down side. |
|
22 |
Select Tag Shift up side |
|
Shift Selected drawn trend up side. |
|
|
|
|
|
|
23 |
Select Tag Shift down side |
|
Shift Selected drawn trend down side. |
|
24 |
Save as image |
|
Trend Save as Image. |
|
25 |
Print Trend |
|
Print the Shown Trend . |
|
26 |
Start Date |
|
Select start date |
|
27 |
End Date |
|
Select end date |
|
28 |
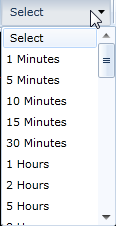
Select Button for Time Duration |
|
Set the duration of horizontal bar. |
|
29 |
Set Speed |
|
Set Speed for Live Trend (Set 1 for 3 Seconds & Set 2 for 6 Seconds Right Shift) |
|
30 |
Set Configuration |
|
Set vertical & horizontal slots. (Set all 10.) |


- Function Details :
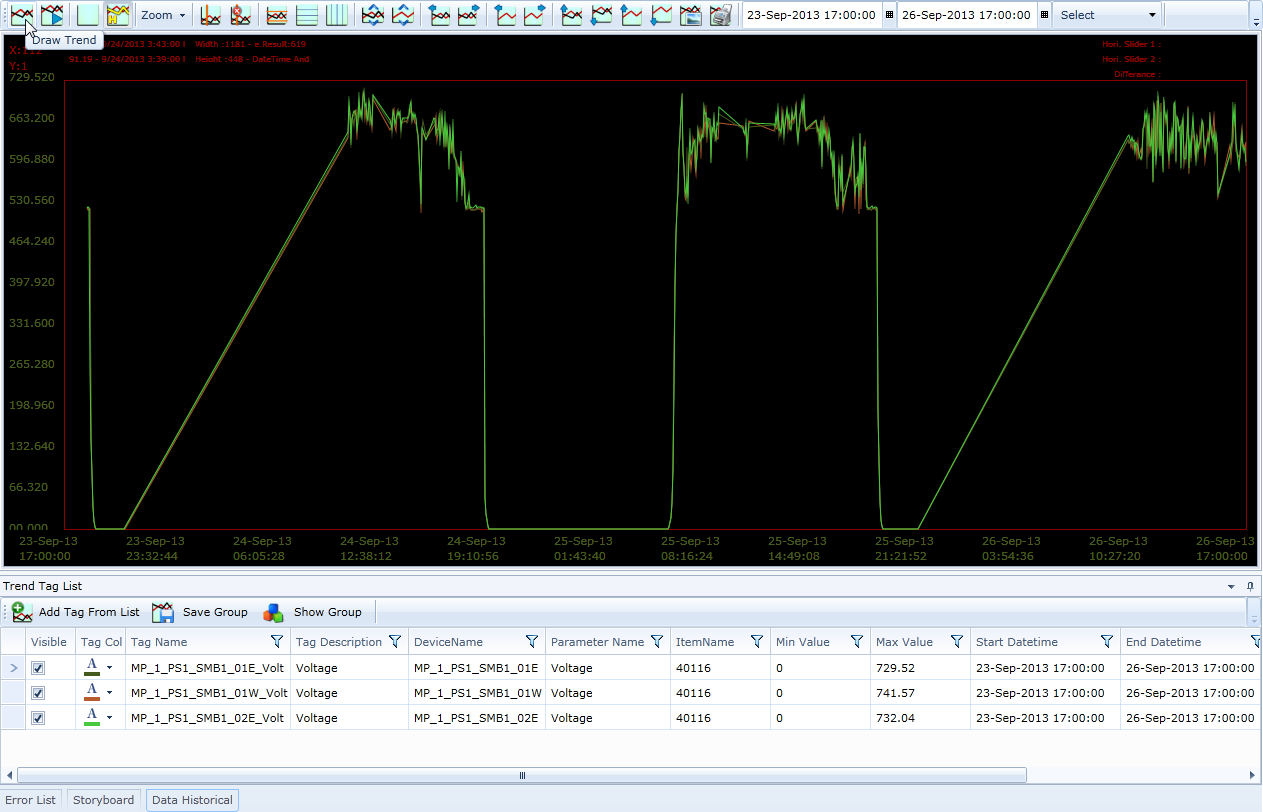
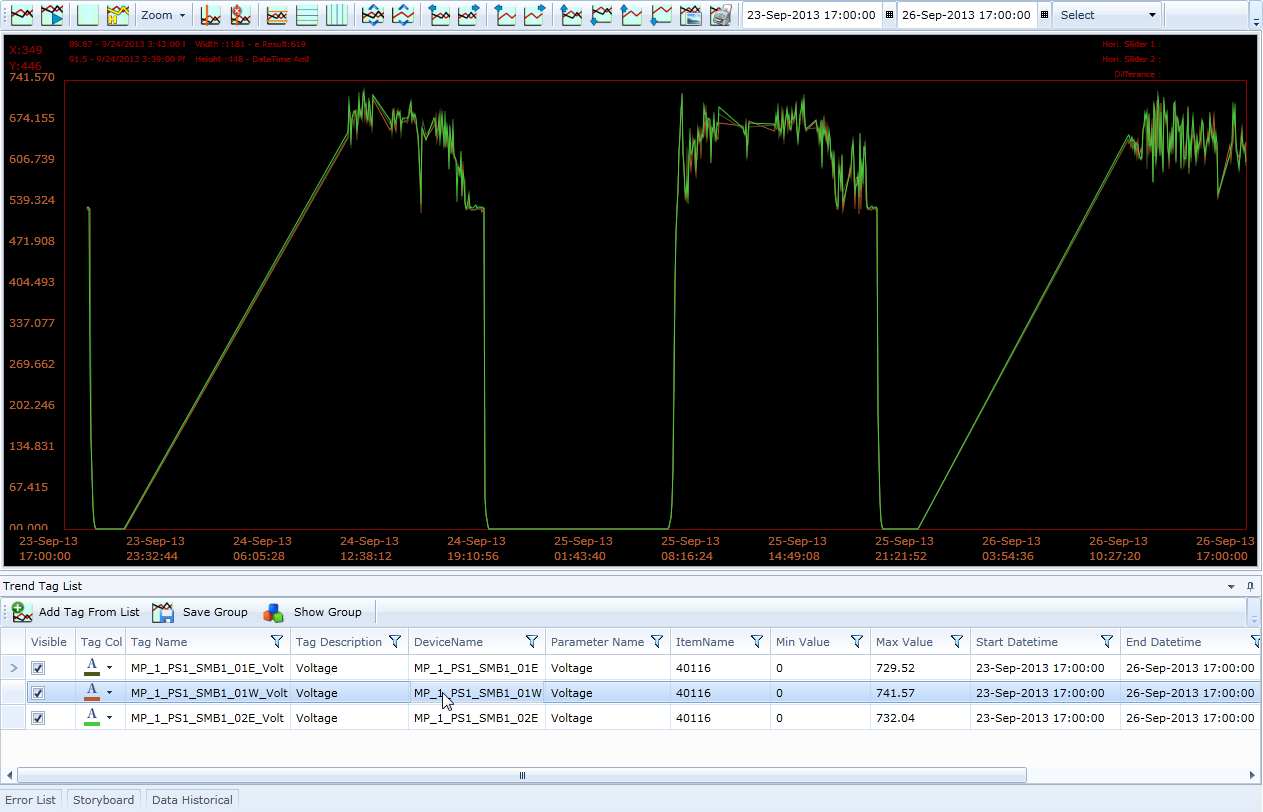
- Drawn Trend
:
- Drawn trend button use for draw the trend first you set the time in Time Toolbar for start and end date you want to show the trend then click it like below figure :
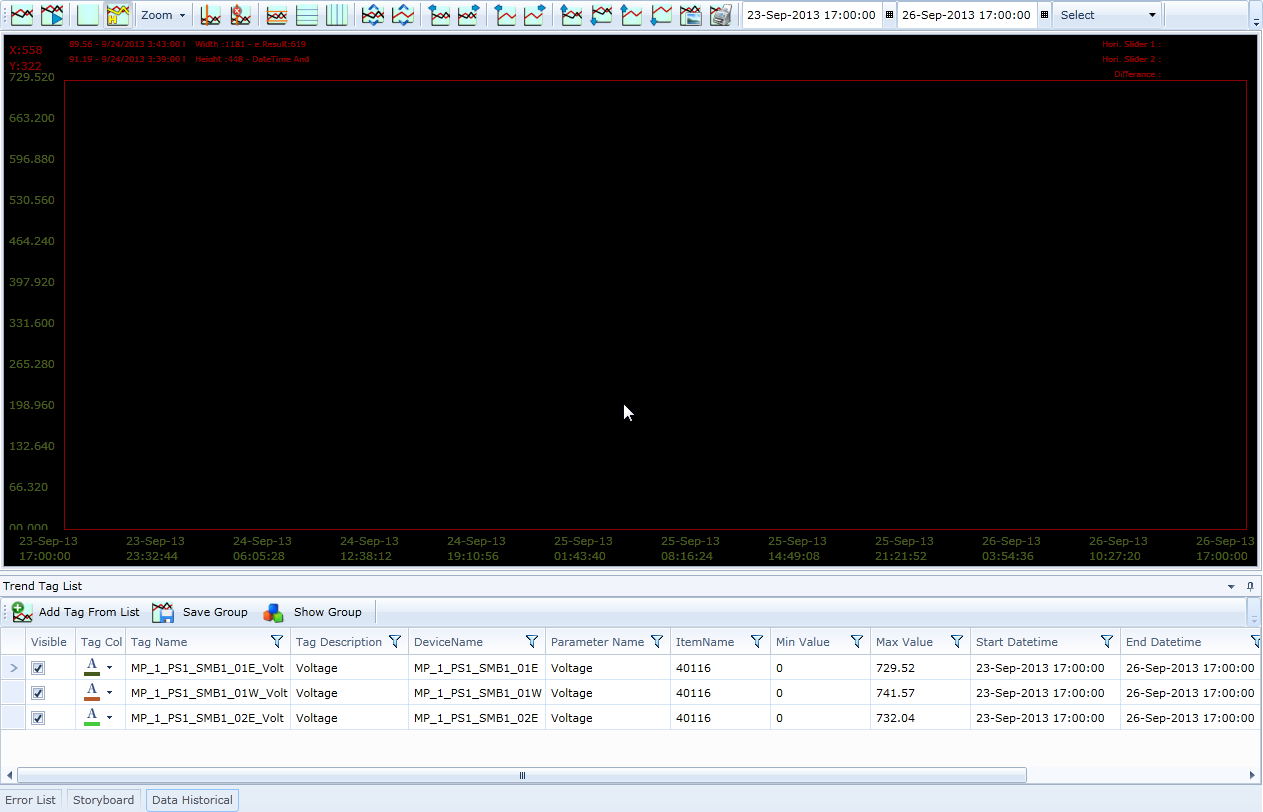
Now if you click on 'Draw Trend' , then it will show below window :
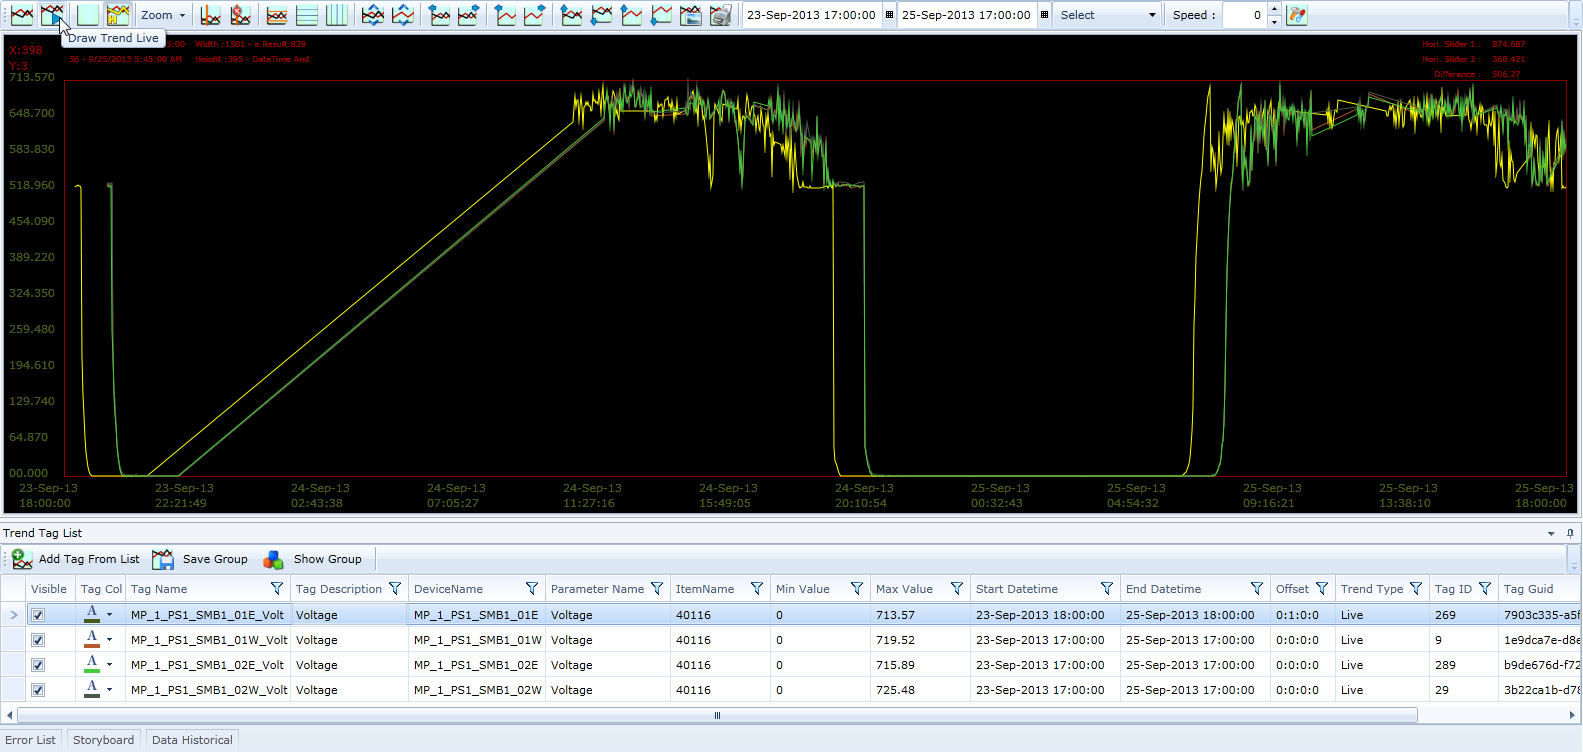
- Online Trend :
- It's used for draw the Live trend then select speed for the live trend. Set speed 1 for 3 seconds and more as respectively.
- Clear All :
- It's used for remove the all trend.
Now if you click on 'Clear All' , then it will display below window :
![]()
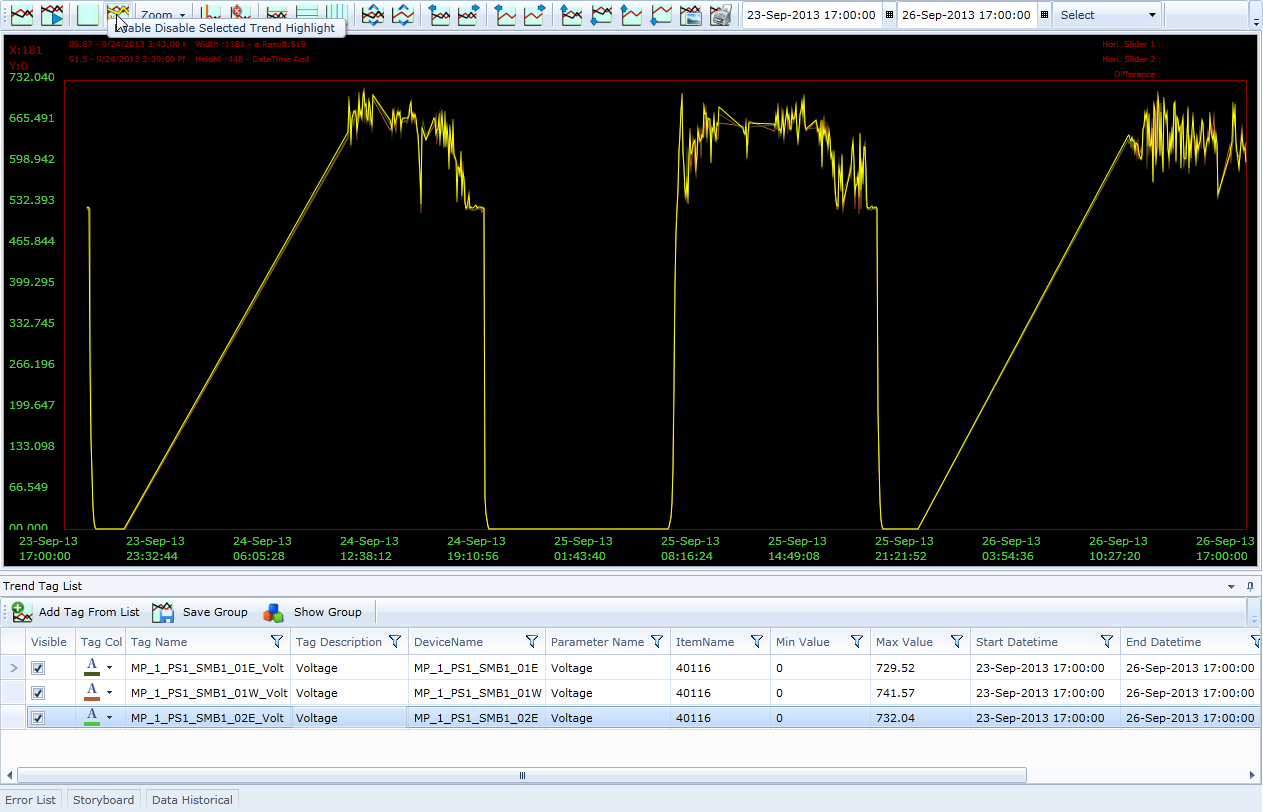
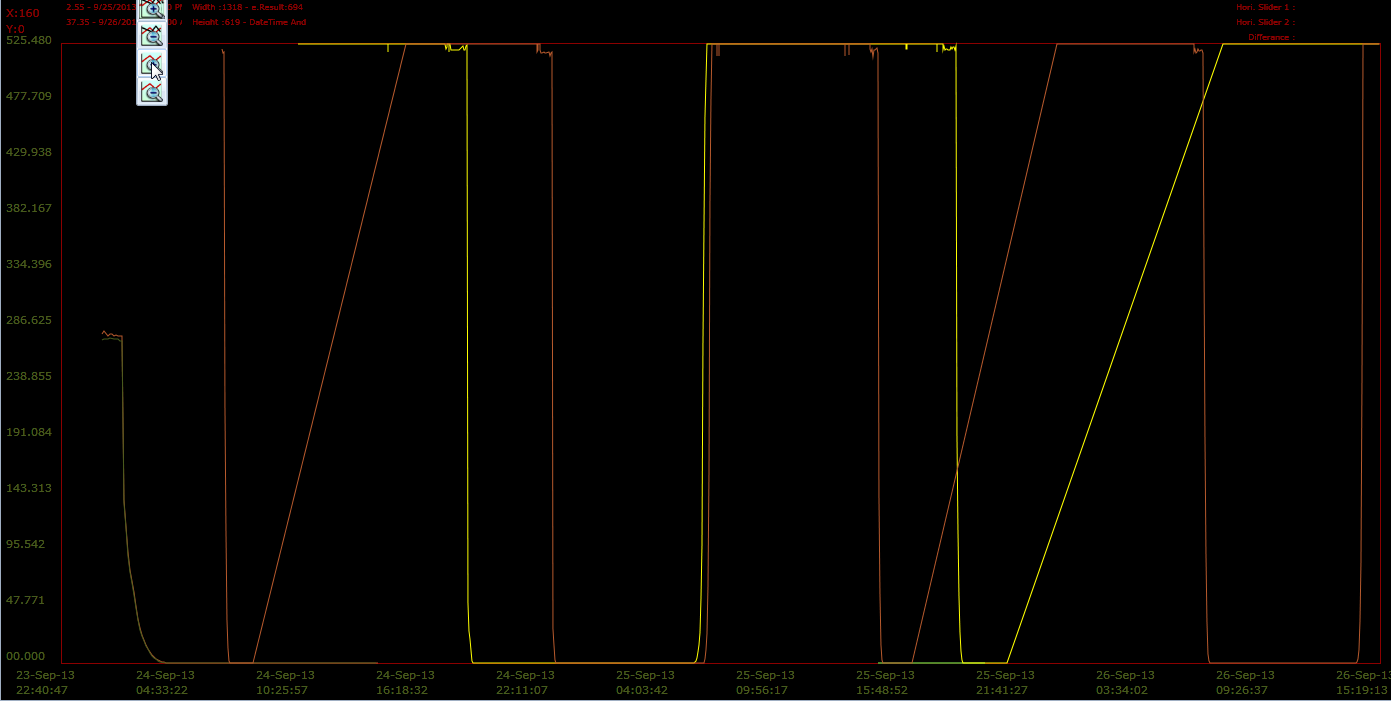
- HighLight :
- It's used for whatever you select the trend so that trend is highlight by Yellow color. If you want to disable this command by select highLight button or you can change this color by configuration button.
- First you select any tag like below figure :
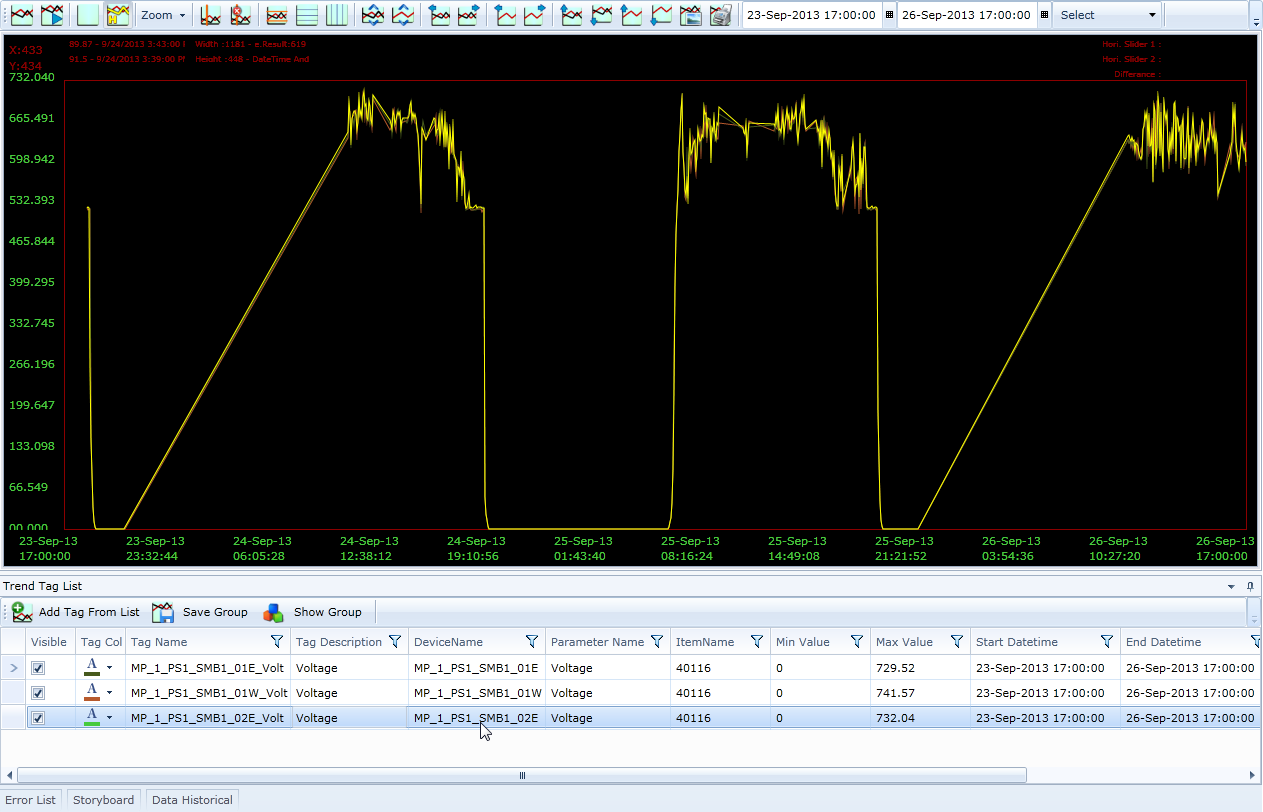
After select tag, Click on 'Highlight' , then It will display like below figure :
Another tag of trend is not display in HighLight color(yellow), only selected tag is display in HighLight color(Yellow).
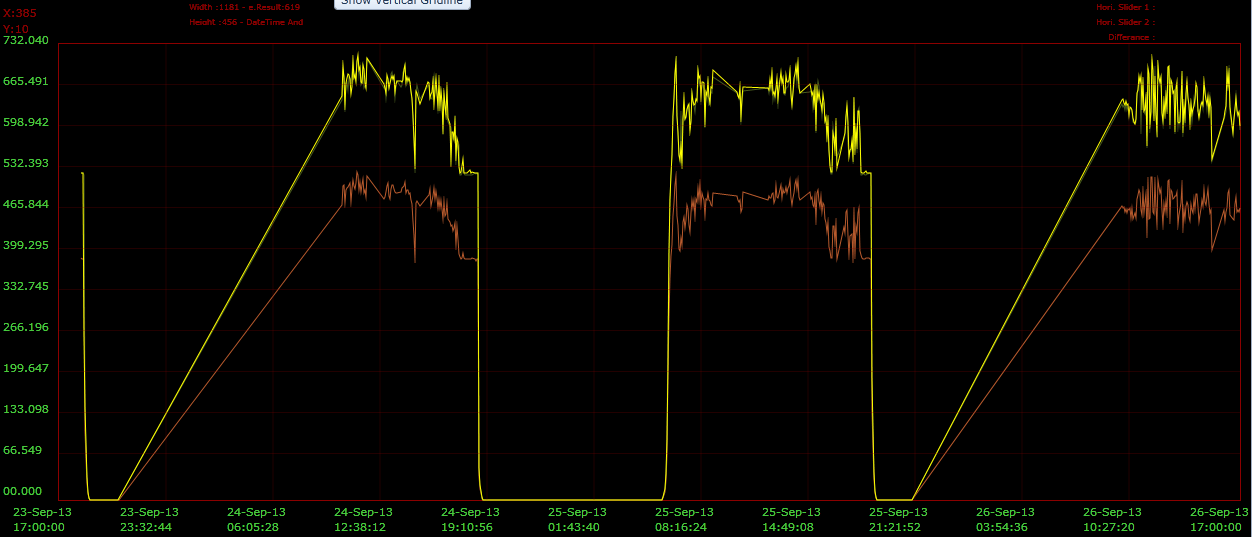
- Zoom In All Tags :
- It's used for maximize the all tag as shown in below figure :

Now if you Click on 'Zoom In all Tags', then it will display like below figure :
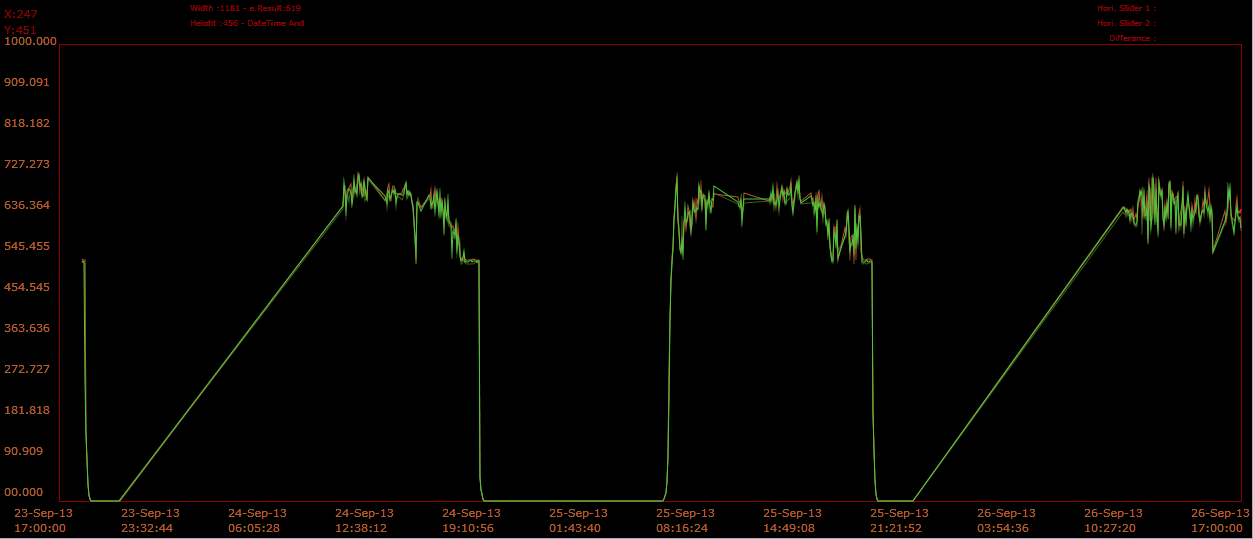
- Zoom Out all Tags :
- it's used for minimize the all tag as shown in below figure :

Now if you Click on 'Zoom Out all Tags', then it will display like below figure :

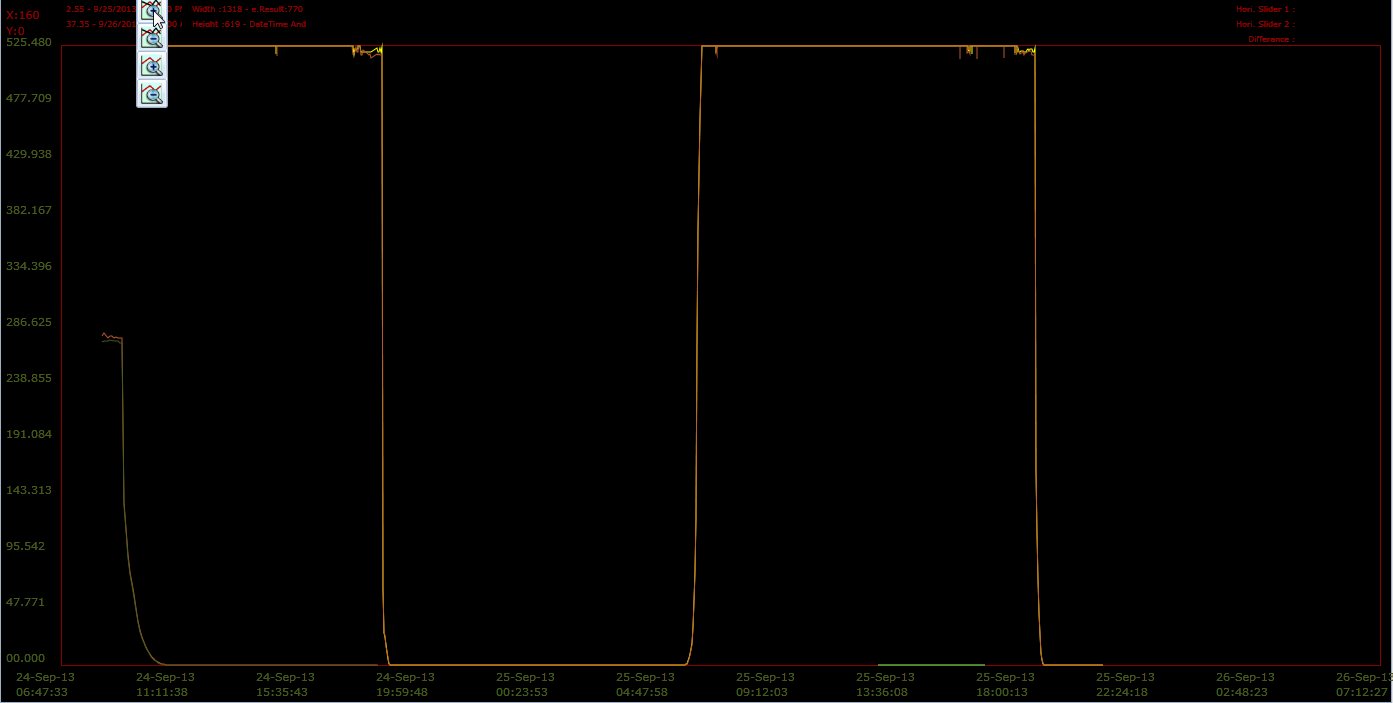
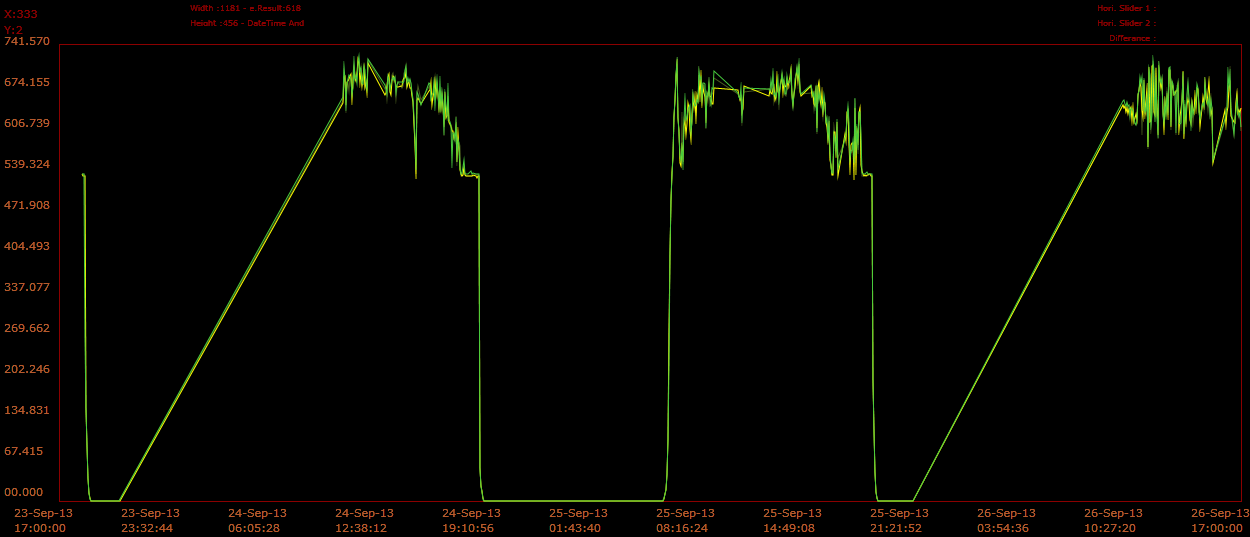
- Zoom In Selected Tag :
- it's used for maximize the Selected tag as shown in below figure :
Now if you Click on 'Zoom In Selected Tag', then it will display like below figure :
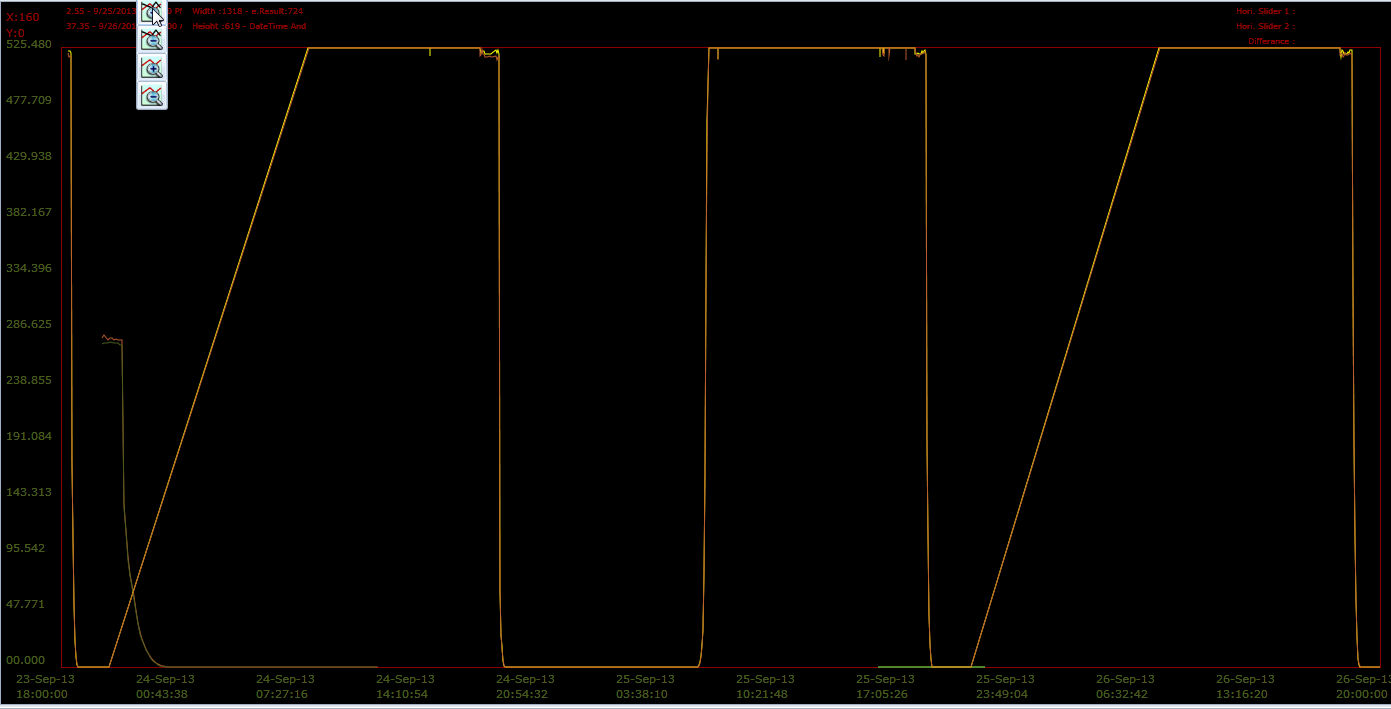
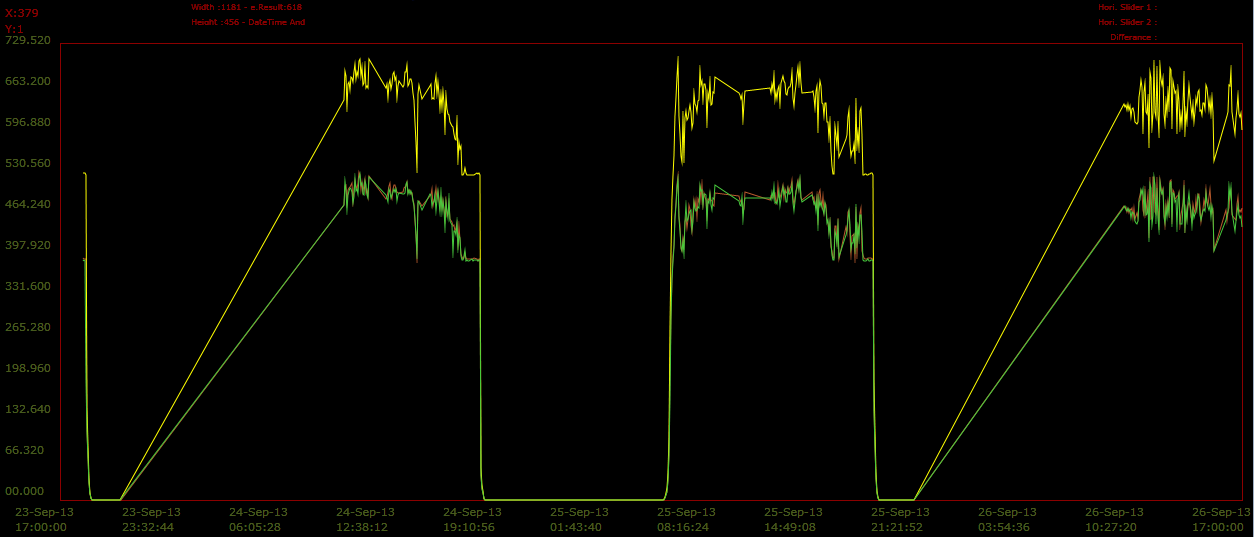
- Zoom Out Selected Tag :
- It's used for minimize the selected tag as shown in below figure :

Now if you Click on 'Zoom Out Selected Tag', then It will display like below figure :

- Vertical Slider :
- It's used for to check the value of trend for particular region.
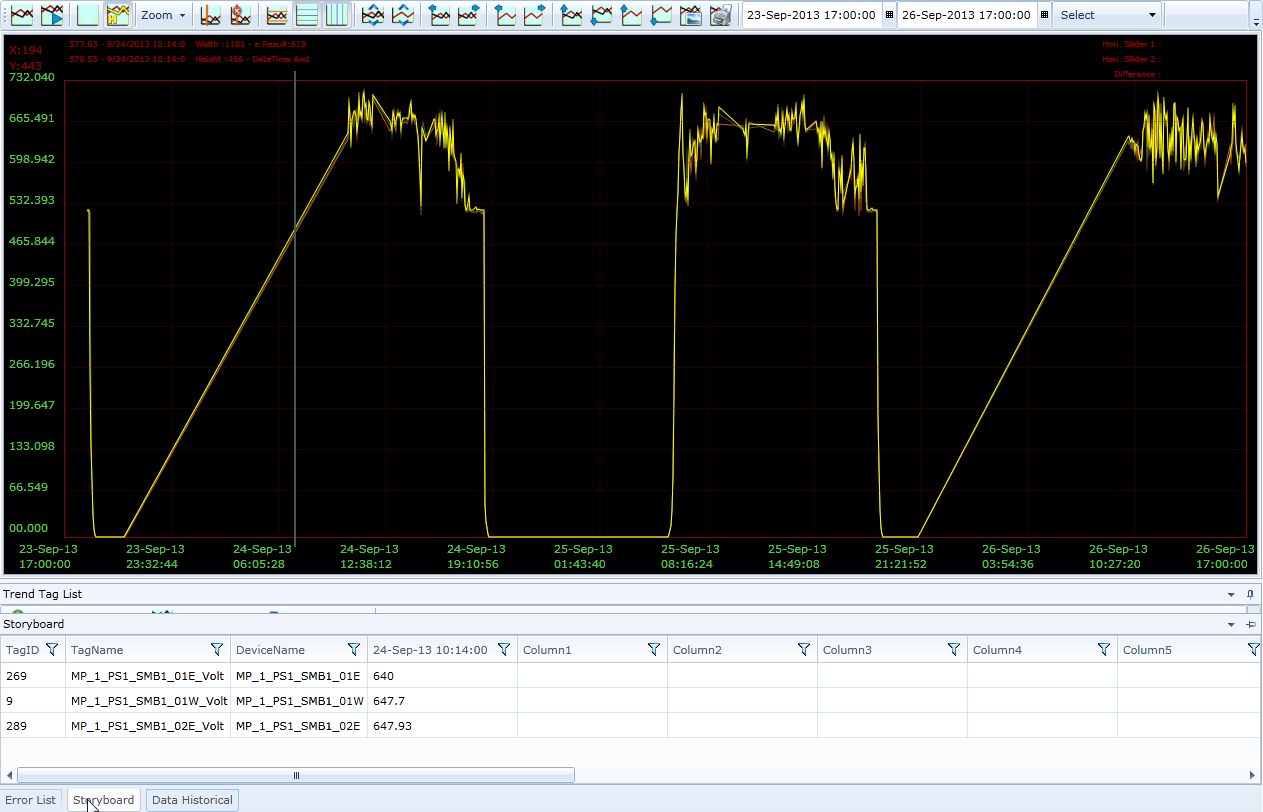
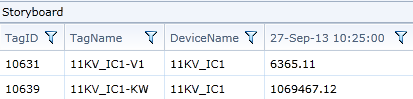
- If we add Vertical slider then the value of trend is display in StoryBoard and StoryBoard is the left down corner middle button in Bottom of Chart pane. If you Click on 'StoryBoard' then it will display like below figure :
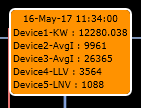
- And also you can see the Tool-trip on vertical slider, which is display value of all tag on time.
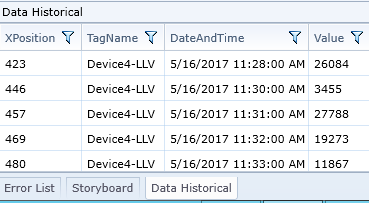
- Right side of 'StoryBoard' button that is "Data Historical', Which is display the value of trend at particular time instance.
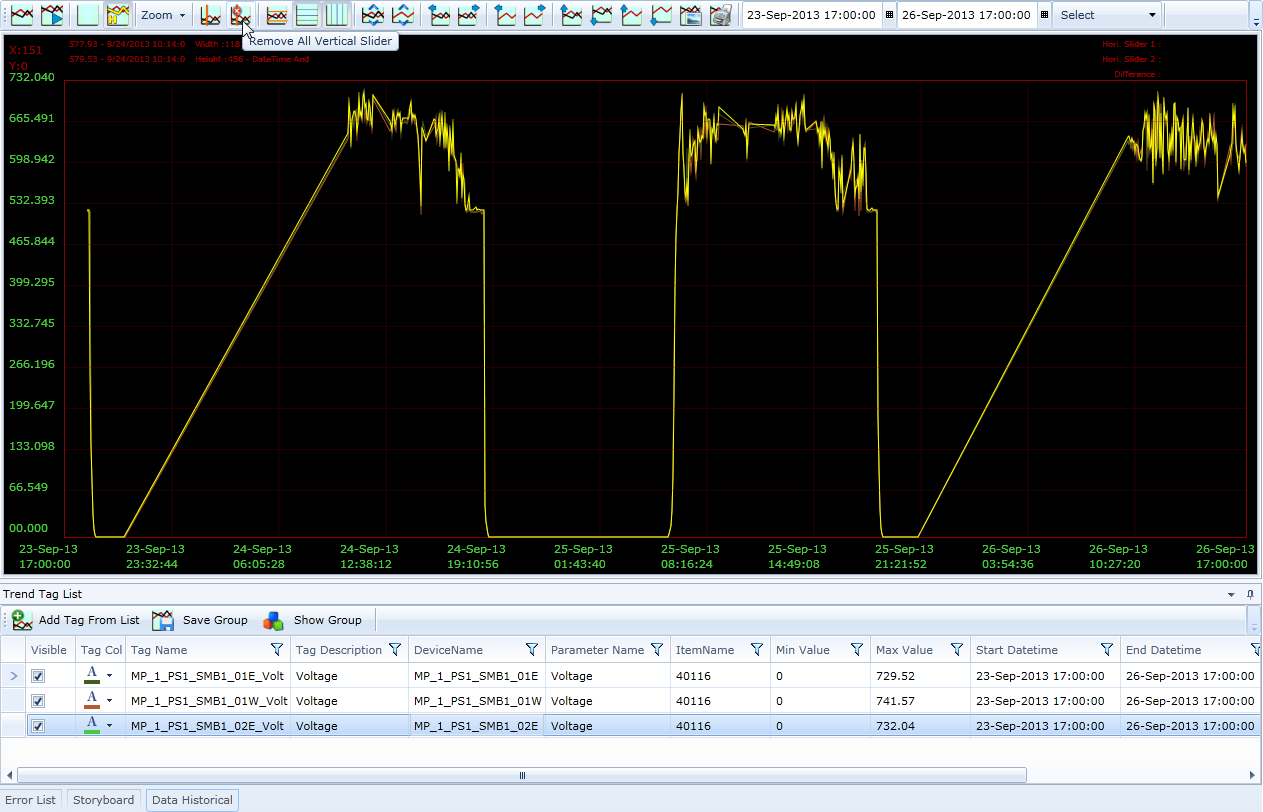
- Remove Slider :
- It's used for removing the all horizontal-vertical slider in Chart pane.
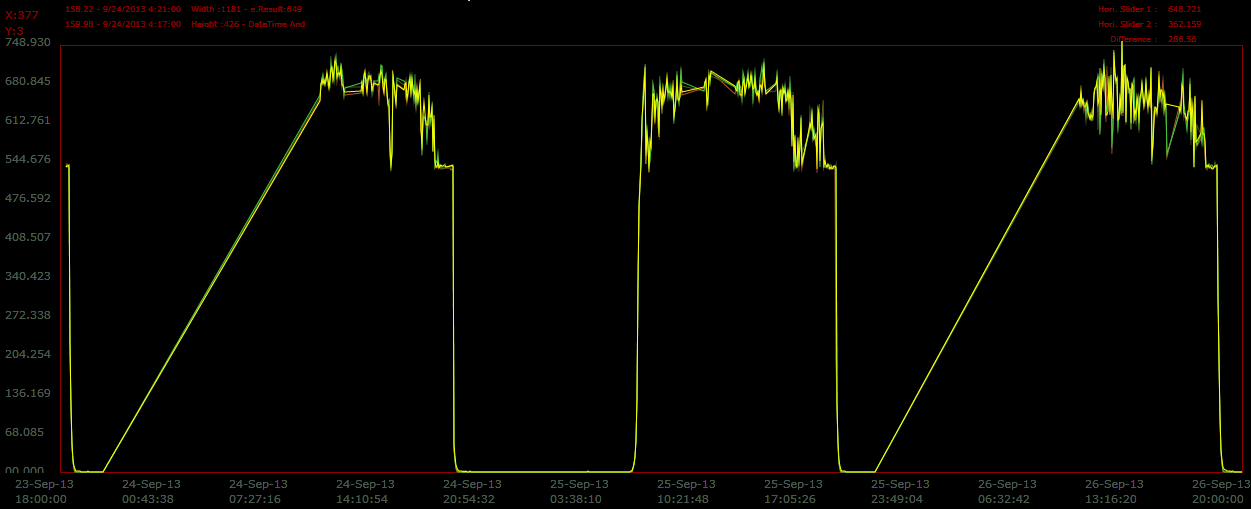
- Horizontal Slider :
- By select horizontal slider button see the difference of two horizontal sliders at right side corner as shown in below figure :
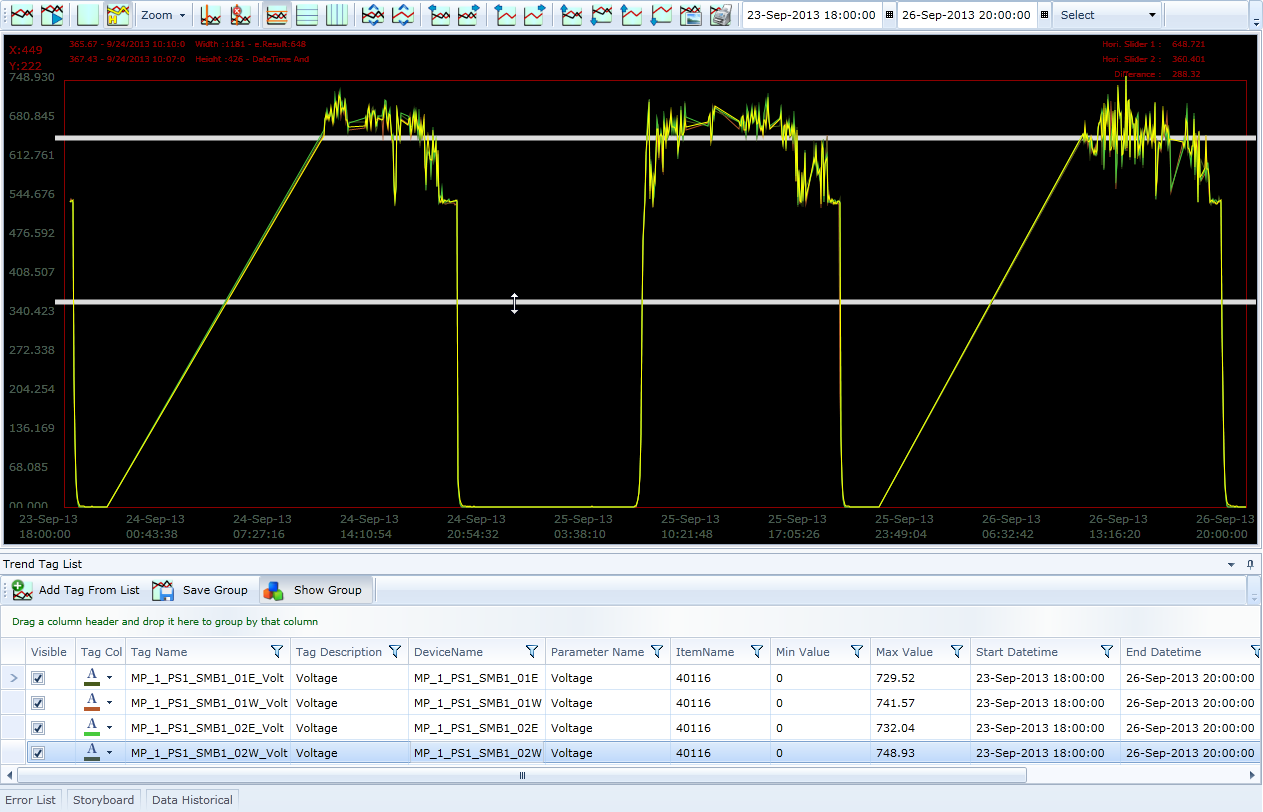
- If we add horizontal slider that is, display the difference of two horizontal sliders value at upper right corner which is display like below figure :
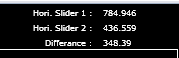
|
Horizontal Slider 1 |
Display upper slider trend value at you does not move towards the down side. |
|
Horizontal Slider 2 |
Display down slider trend value at you does not move towards the upper side. |
|
Difference |
Display the difference value horizontal slider 1 and horizontal slider 2. |
- Horizontal Grid Line :
- It's used for to add Horizontal grid line in Chart Pane.
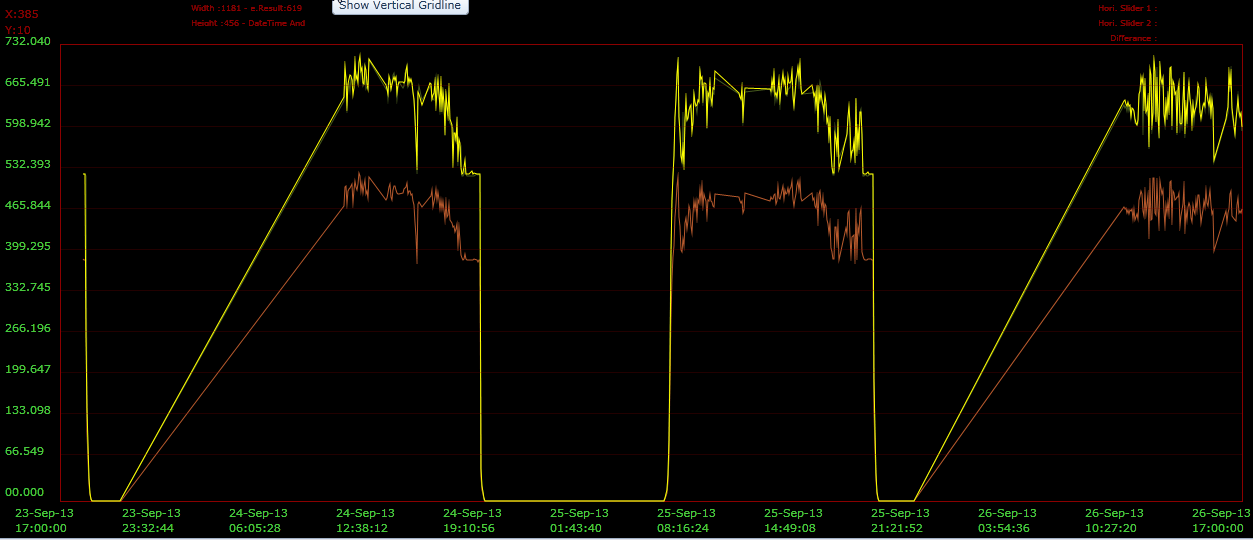
- Vertical Grid Line :
- It's used for to add vertical grid line in Chart Pane.
- Auto Scrolling of all Tag:
- It's used to set the upper or lower limit automatically for all tags.
Now if you Click on 'Auto Scrolling of all Tags', then it will display like below figure :
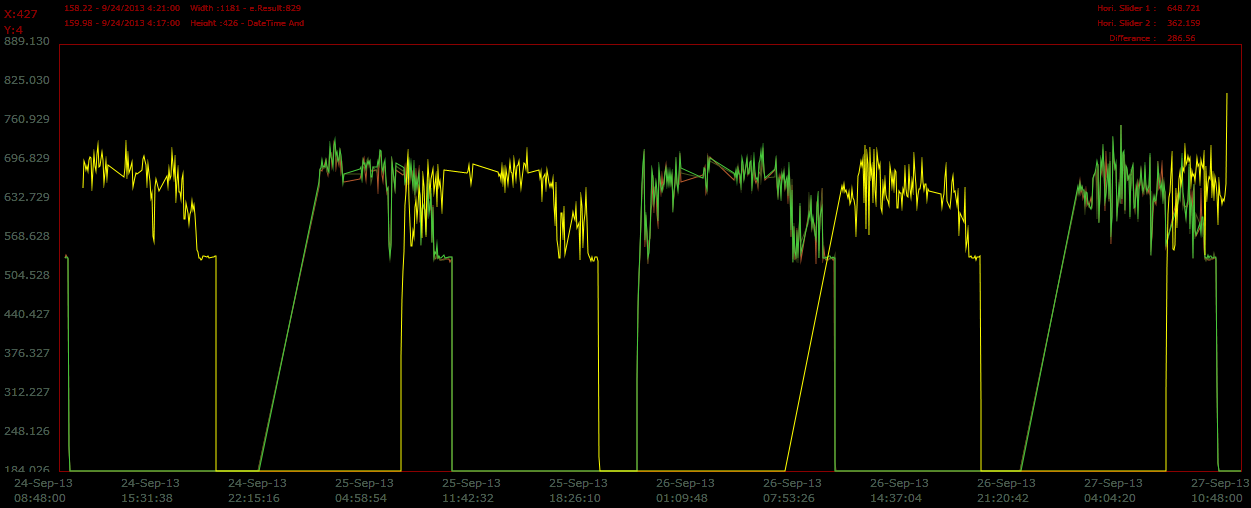
- Auto Scaling of Selected Tag:
- It's used to set the upper or lower limit automatically for selected tag.

Now if you Click on 'Auto Scrolling of Selected Tag', then it will display like below figure :
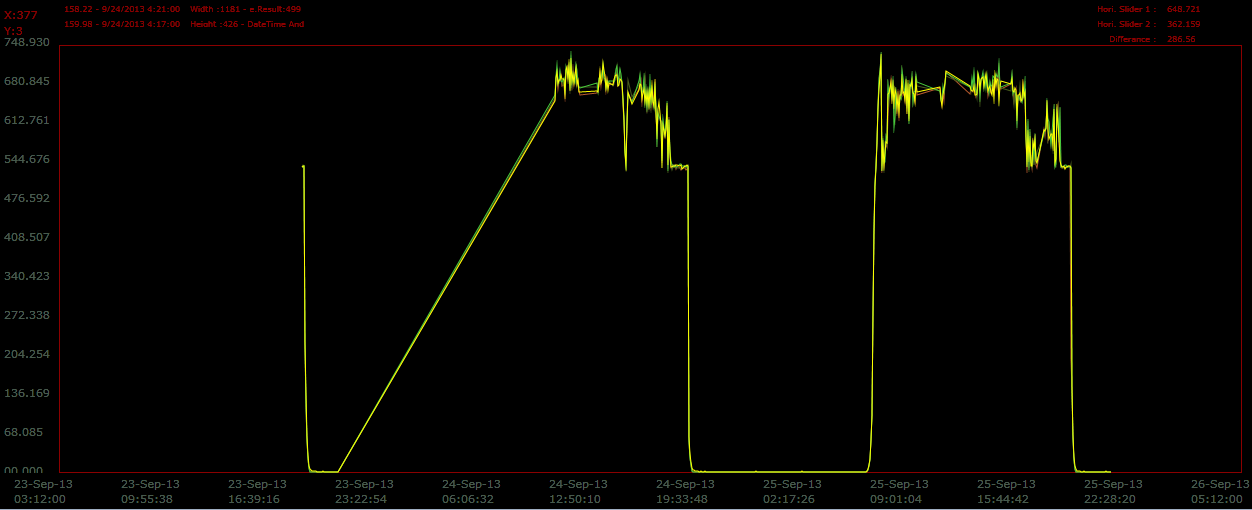
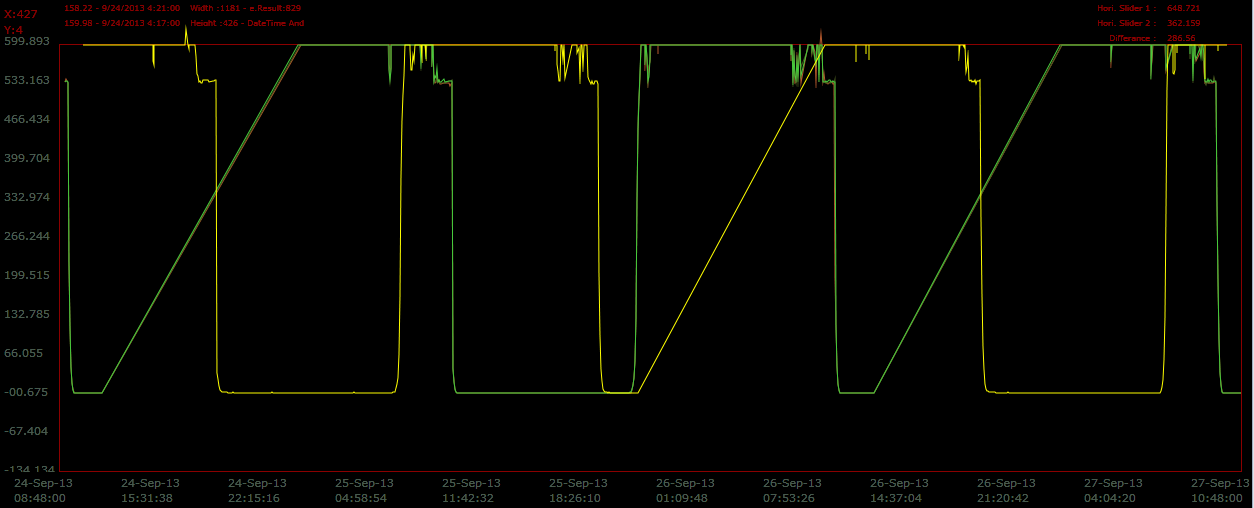
- Drawn Trend Shift Left Side :
- It's used to move all tag left side.
Now if you Click on 'Drawn Trend Shift Left Side', then it will display like below figure :
- Drawn Trend Shift Right Side :
- It's used to move all tag Right side.
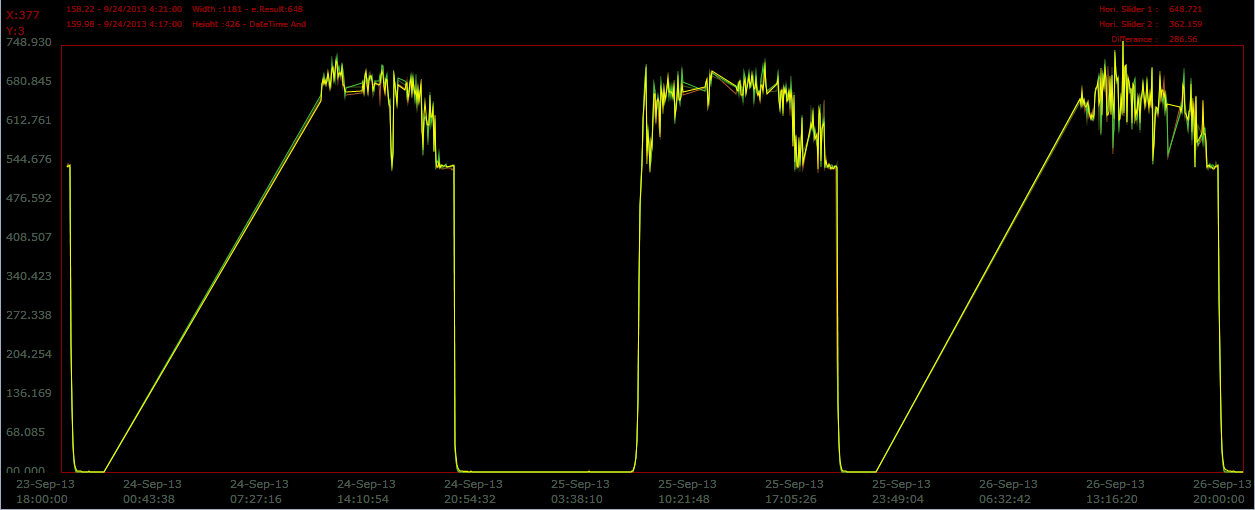
Now if you Click on 'Drawn Trend Shift Right Side', then it will display like below figure :
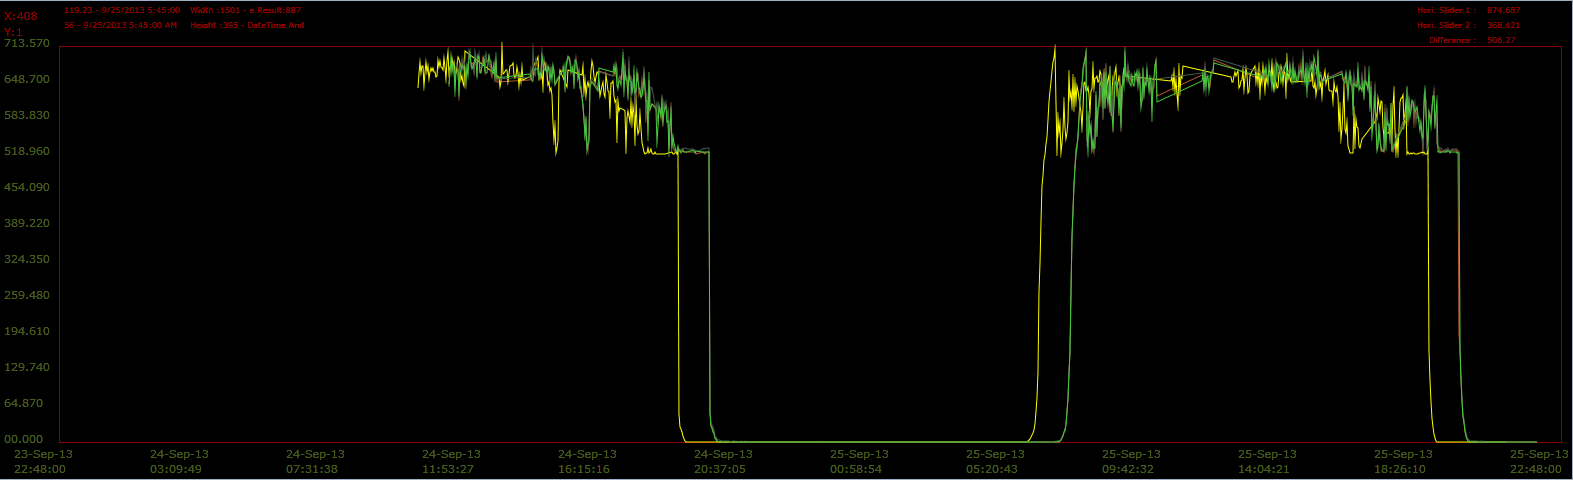
- Select Tag Shift Left Side :
- It's used to move selected tag left side.

Now if you Click on 'Select Tag shift Left Side', then it will display like below figure :

- Select Tag Shift Right Side :
- It's used to move selected tag right side.

Now if you Click on 'Select Tag Shift Right Side', then it will display like below figure :

- Drawn Trend Shift UpSide :
- It's used to move all tag Up side.

Now if you Click on 'Drawn Trend Shift Upside', then it will display like below figure :
- Drawn Trend Shift DownSide :
- It's used to move all tag Down side.

Now if you Click on 'Drawn Trend Shift Downside', then it will display like below figure :
- Select Tag Shift Up Side :
- It's used to move selected tag Up side.

Now if you Click on 'Select Tag Shift Up Side', then it will display like below figure :

- Select Tag Shift Down Side :
- It's used to move selected tag Down side.

Now if you Click on 'Select Tag Shift Down Side', then it will display like below figure :

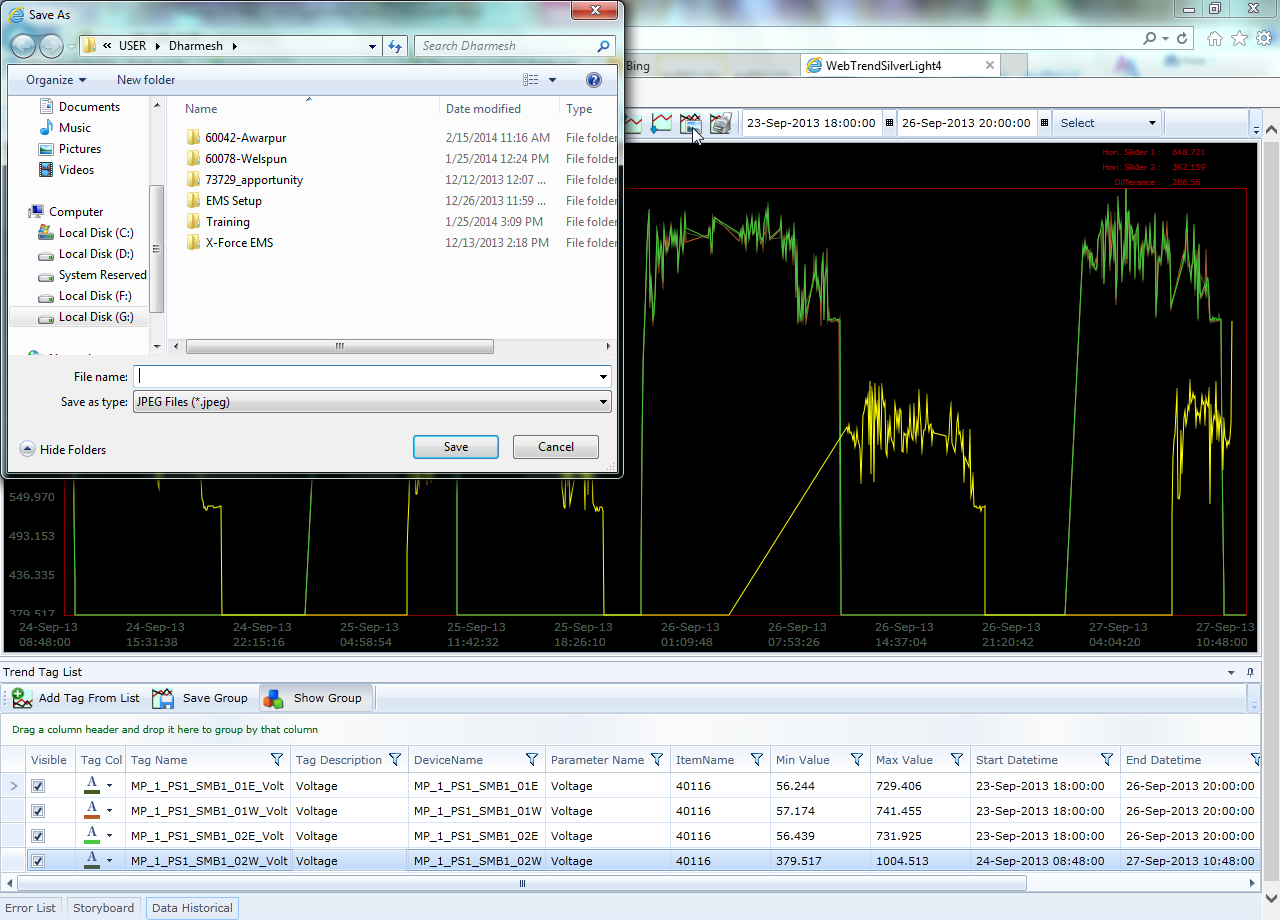
- Save/Export trend as Image :
- It's used for to Save/Export Trend in Image Format.
- you can save by 'save as' image button and you set the name of image.
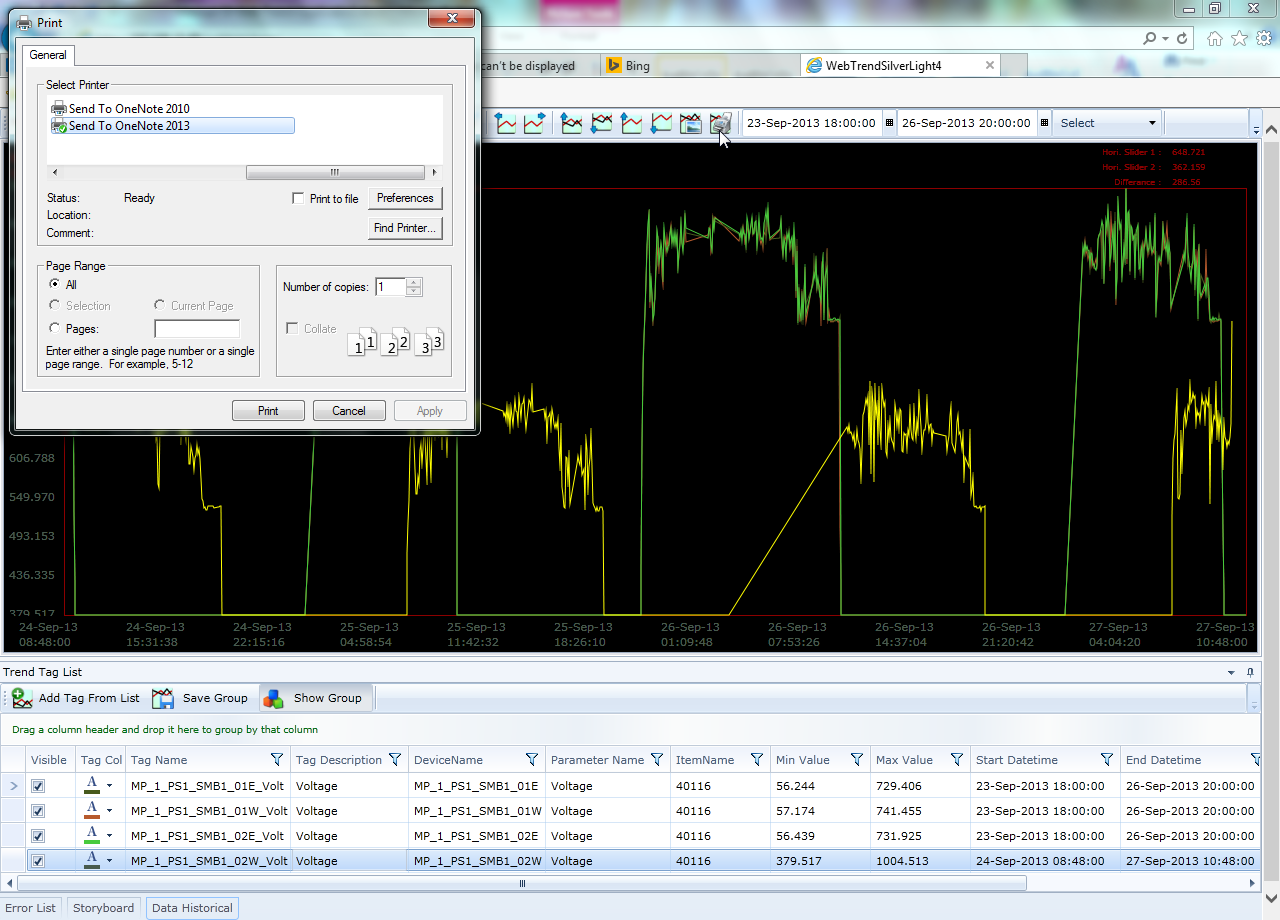
- Print Trend :
- It's used to print trend view.
- Click on 'Print Trend', then it will display like below figure :