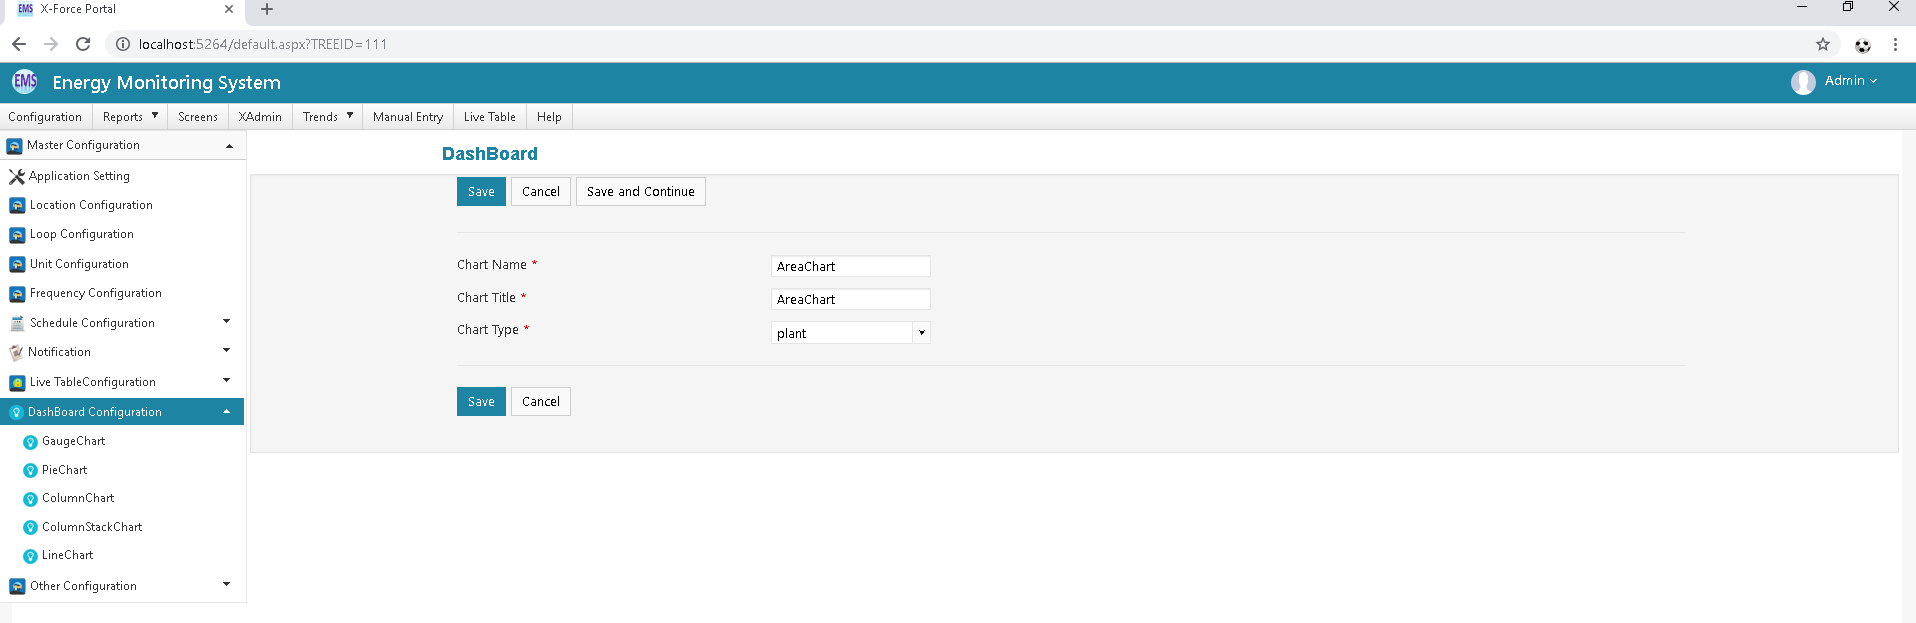
Area Chart
After Click on Add new Button Let's Configure Area chart all Required Field.
<table border="1">
<caption>Pie Chart Detail</caption>
<thead>
<tr>
<th scope="col">Sr No</th>
<th scope="col">Column</th>
<th scope="col">Column Description</th>
</tr>
</thead>
<tbody>
<tr>
<th scope="col">1</th>
<td>Chart Name</td>
<td>it should be given meaning full name for chart.</td>
</tr>
<tr>
<th scope="col">2</th>
<td>Image on Button</td>
<td>Select suitable image on button.</td>
</tr>
<tr>
<th scope="col">3</th>
<td>Control Type</td>
<td>Select control type like Pie chart, bar</td>
</tr>
<tr>
<th scope="col">4</th>
<td>Header Text</td>
<td>it should be given suitable header text.</td>
</tr>
<tr>
<th scope="col">5</th>
<td>Query value</td>
<td>Write query for which type of data you want o show in chart.</td>
</tr>
<tr>
<th scope="col">6</th>
<td>Chart Height & Width</td>
<td>it should has height and width of chart.</td>
</tr>
<tr>
<th scope="col">7</th>
<td>XaxisColumn</td>
<td>Set Xaxis column value for chart.</td>
</tr>
<tr>
<th scope="col">8</th>
<td>YaxisColumn</td>
<td>Set Yaxis column value for chart.</td>
</tr>
<tr>
<th scope="col">9</th>
<td>Column Title</td>
<td>Set suitable title for both axis.</td>
</tr>
<tr>
<th scope="col">10</th>
<td>Navigation Link</td>
<td>it has given Navigation link for redirect that page and showing Chart Data.</td>
</tr>
<tr>
<th scope="col">11</th>
<td>Div Class</td>
<td>Select Div class from list for suitable design</td>
</tr>
<tr>
<th scope="col">12</th>
<td>Navigation Target</td>
<td>It should be given Navigation target.</td>
</tr>
</tbody>
</table>
<br><br><p></p>
Click on Save Button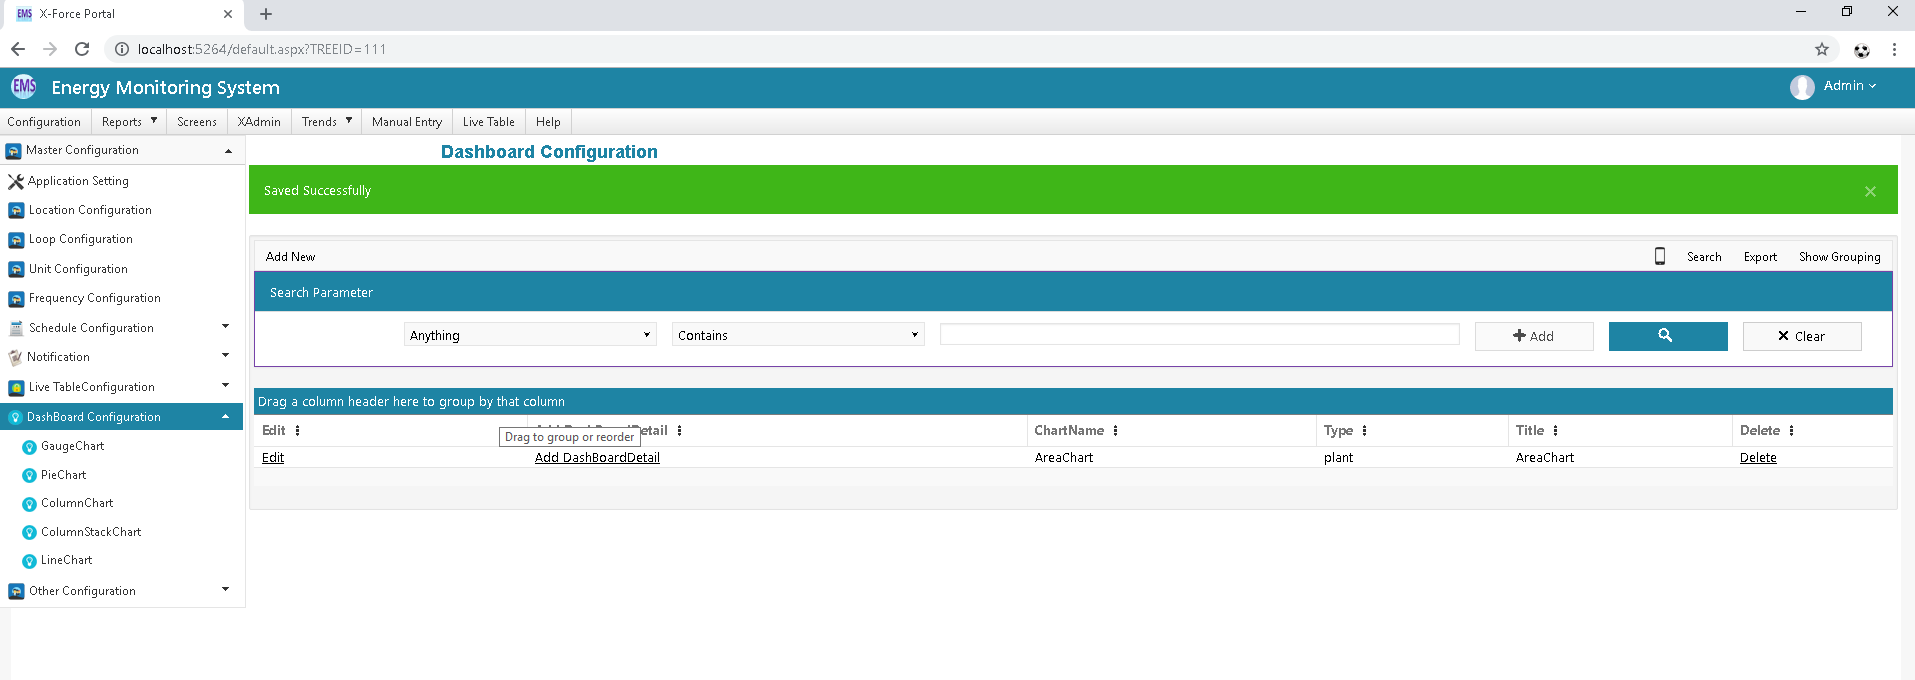
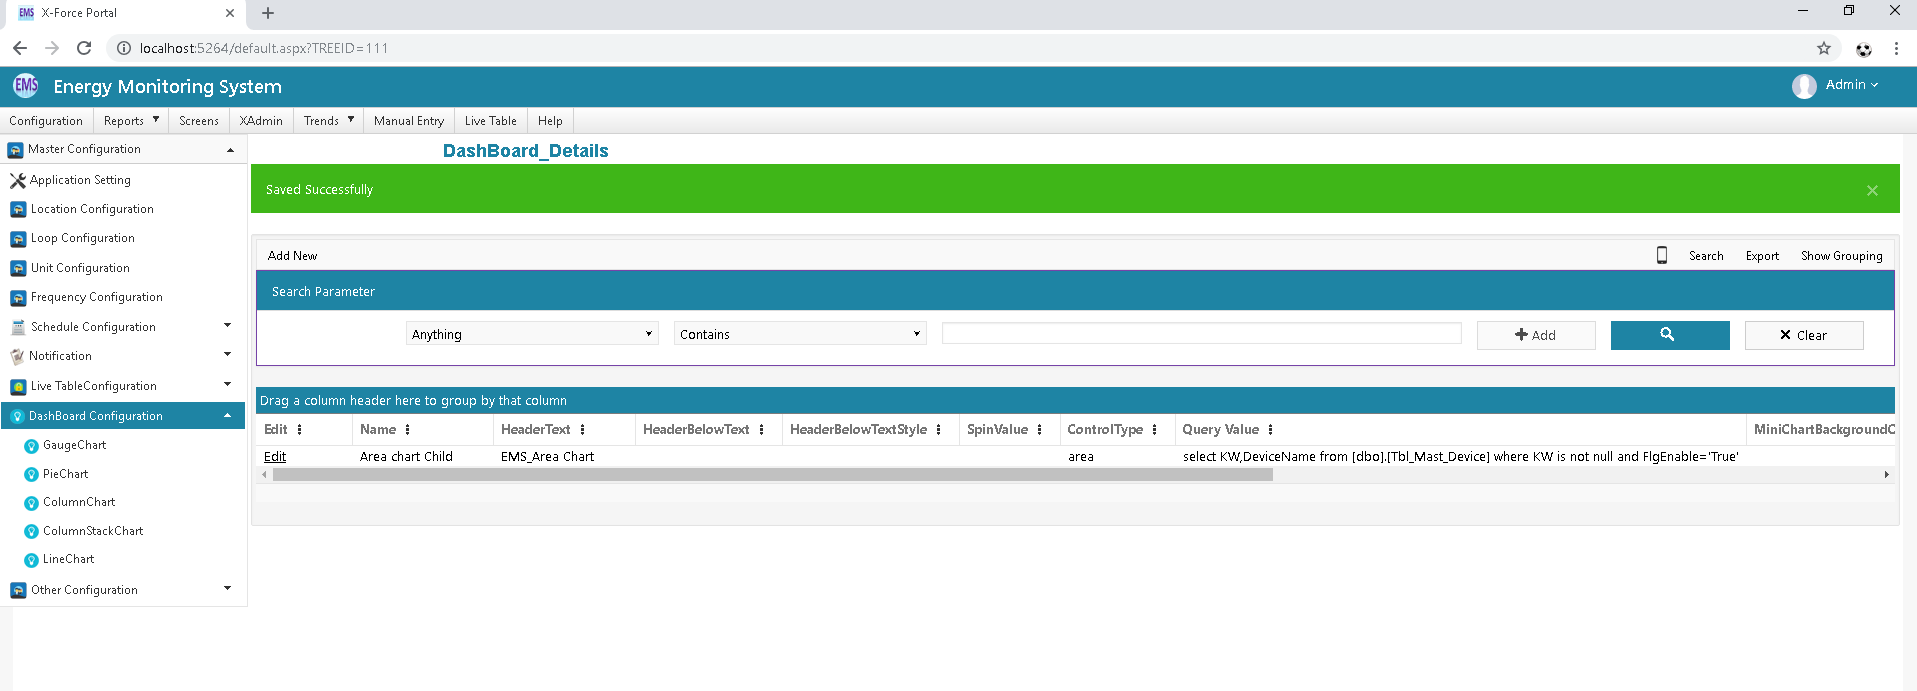
Click on Add Dashboard Detail Respective your Area Chart Dashboard . Click On Add New Button.
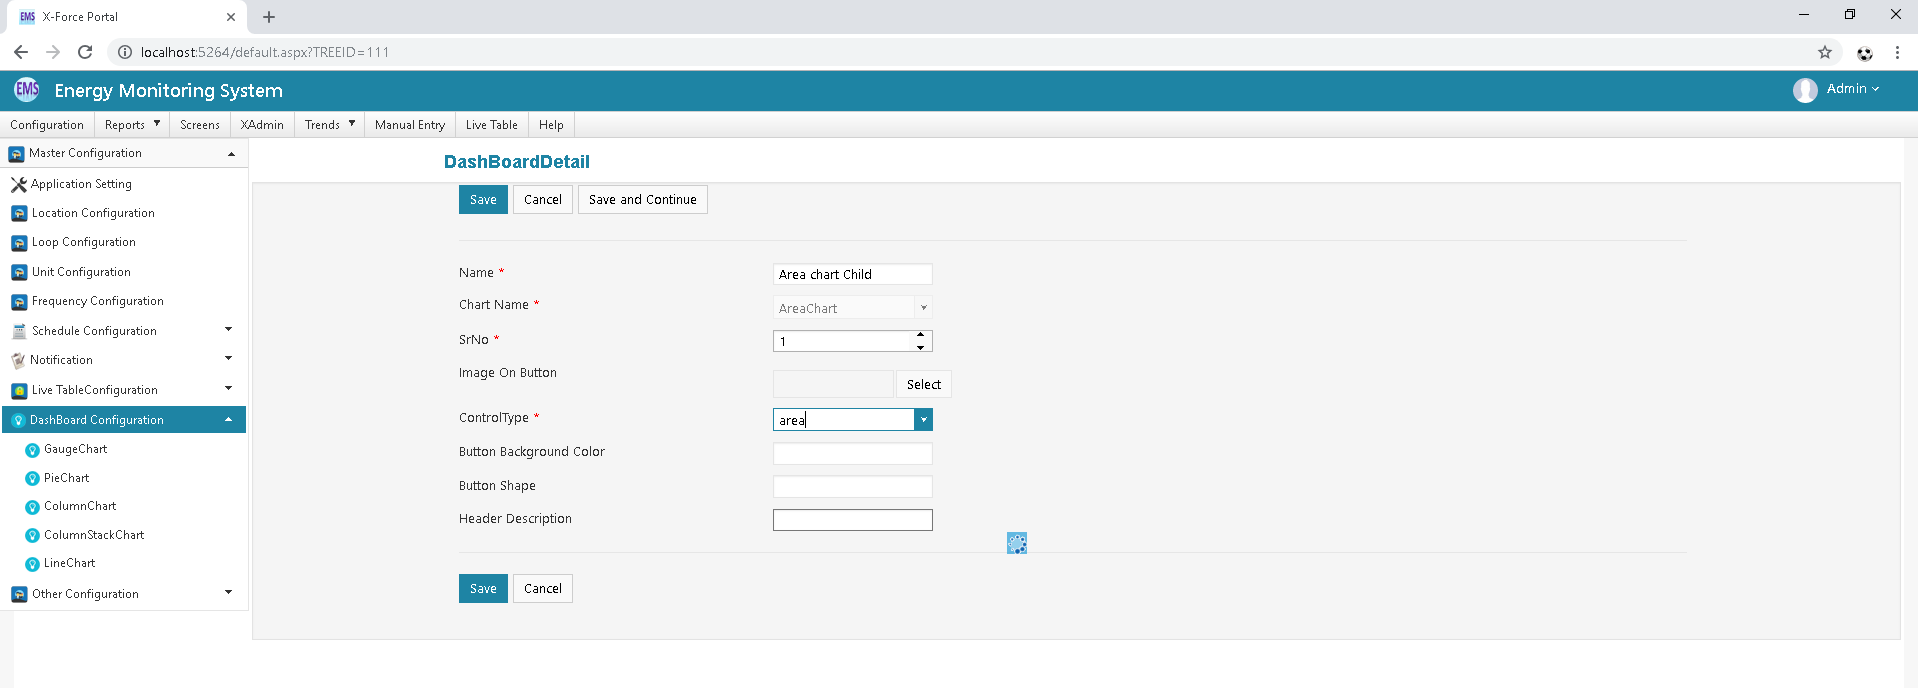
After Select Control Type all Required field Should be display then After Configure all Field.
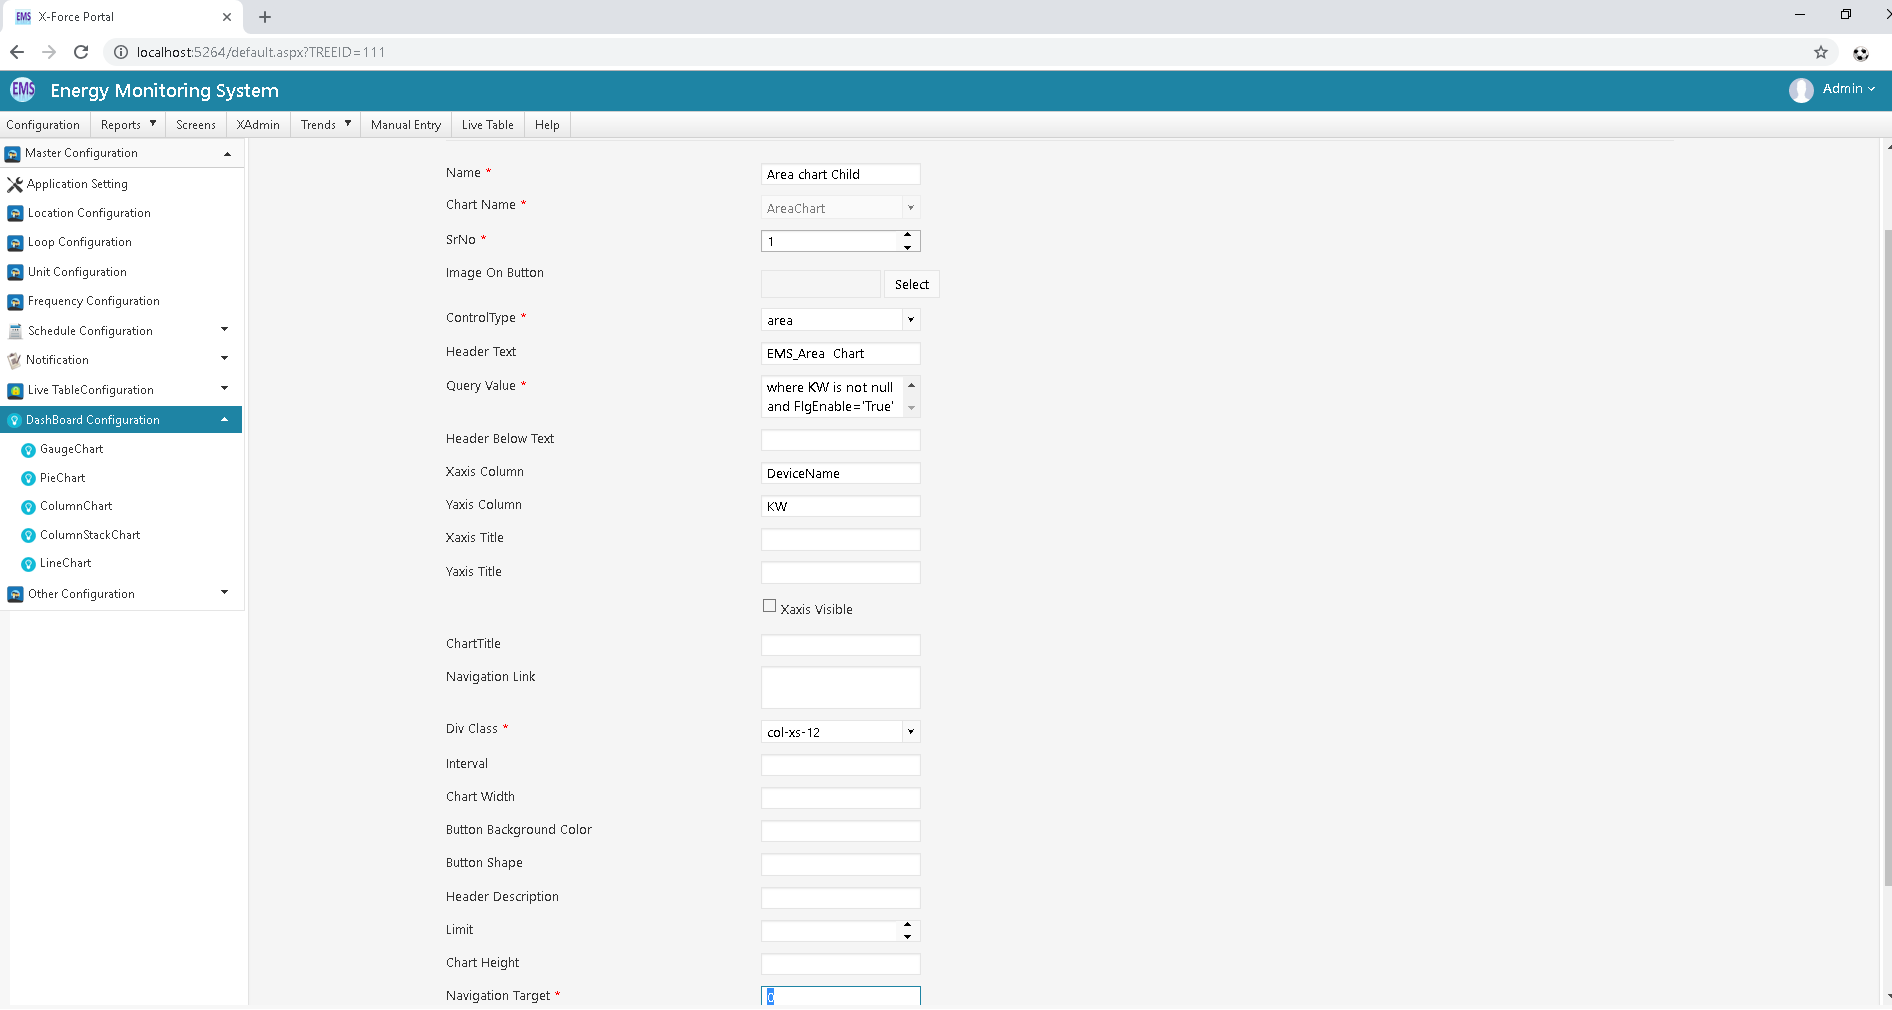
Click on Save button.
After configure Dashboard Please Create Tree link for your Dashboard.
Go to Tree X-Admin Module Configure Tree For Your Area Chart Other Wise Backoffice Database Side You can configure Tree
Node URL: REDIRECT#Dashboard/NewDashboard.aspx?name=AreaChart
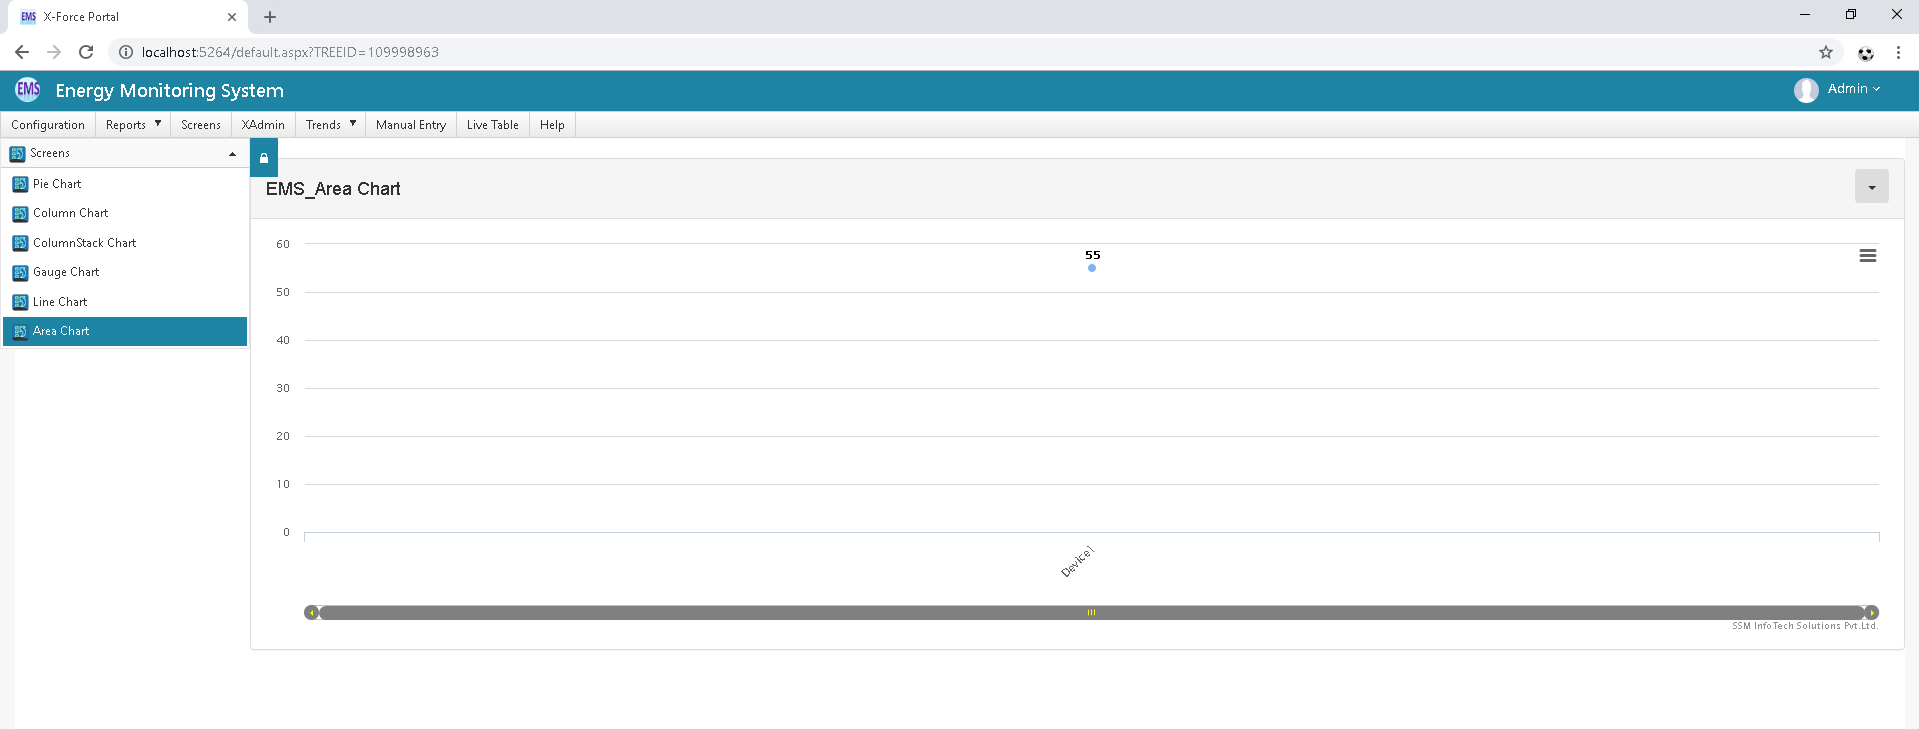
Click on Scree Menu Click ON your chart
| Sr No | Column | Column Description |
|---|---|---|
| 1 | Chart Name | it should be given meaning full name for chart. |
| 2 | Image on Button | Select suitable image on button. |
| 3 | Control Type | Select control type like Pie chart, bar |
| 4 | Header Text | it should be given suitable header text. |
| 5 | Query value | Write query for which type of data you want o show in chart. |
| 6 | Chart Height & Width | it should has height and width of chart. |
| 7 | XaxisColumn | Set Xaxis column value for chart. |
| 8 | YaxisColumn | Set Yaxis column value for chart. |
| 9 | Column Title | Set suitable title for both axis. |
| 10 | Navigation Link | it has given Navigation link for redirect that page and showing Chart Data. |
| 11 | Div Class | Select Div class from list for suitable design |
| 12 | Interval | Set Interval for Area chart. for example Area gap is Interval 5, so execution will be 100-105-110-115 etc. |
| 12 | Navigation Target | It should be given Navigation target. |