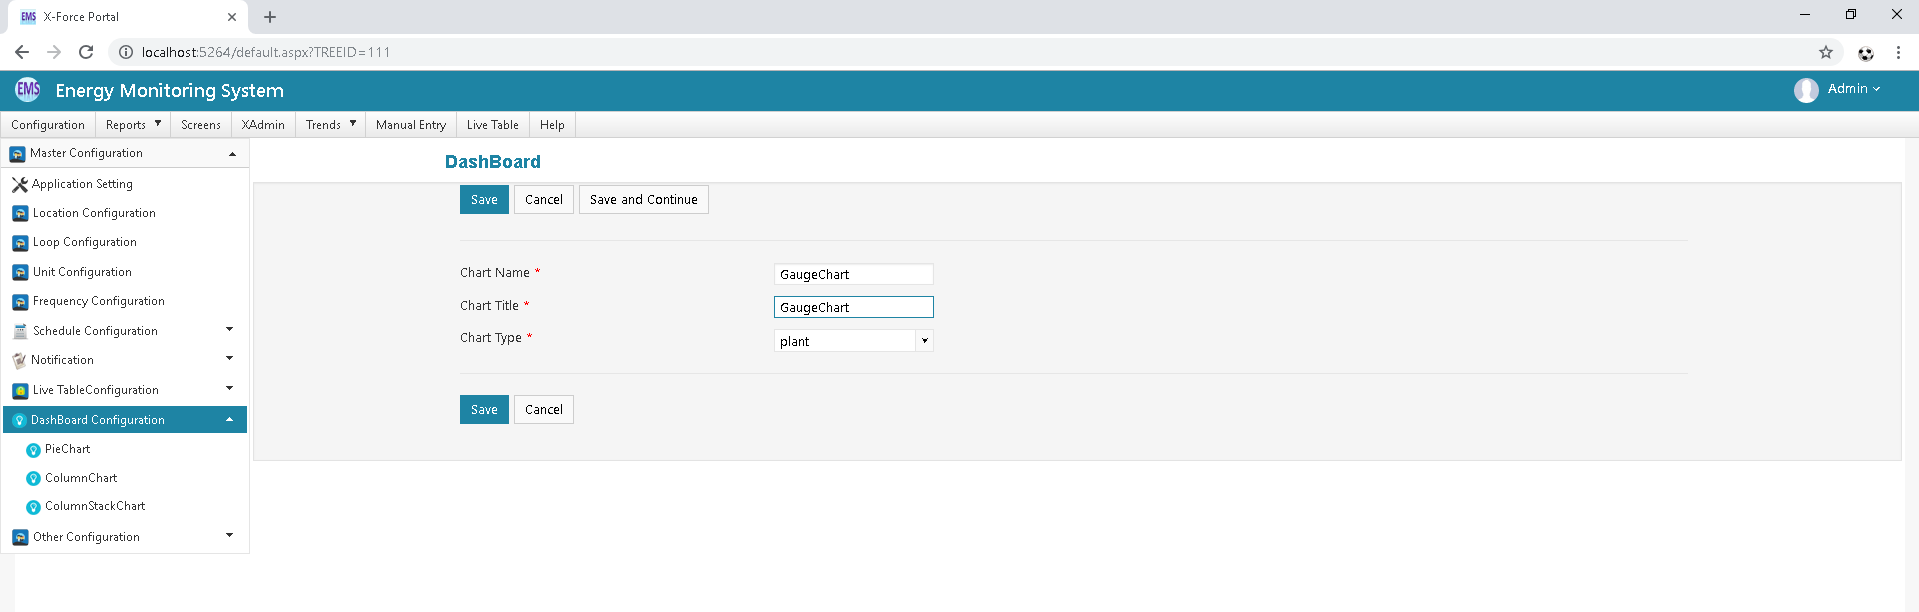
Gauge Chart
After Click on Add new Button Let's Configure Gauge chart all Required Field.
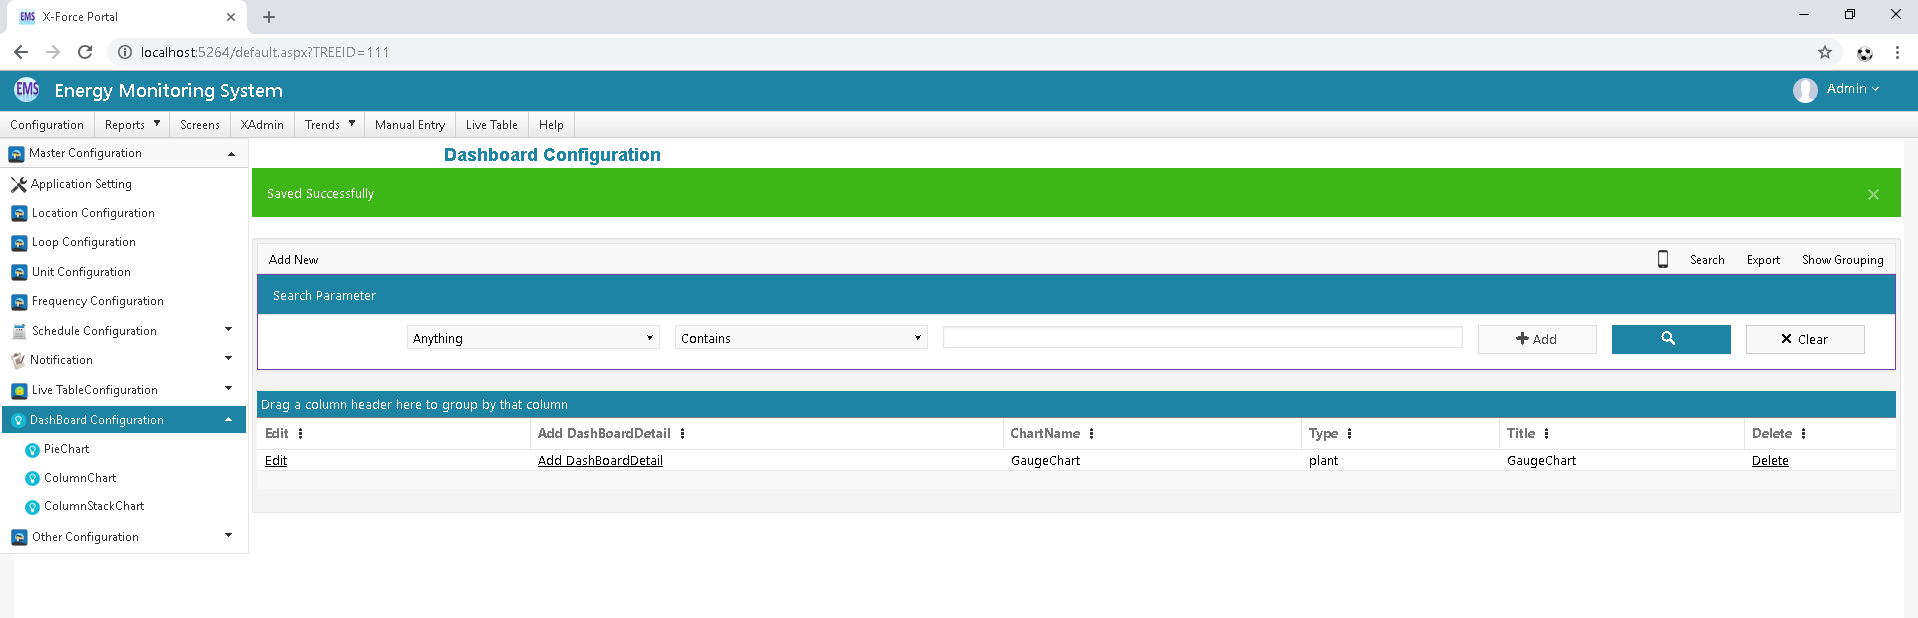
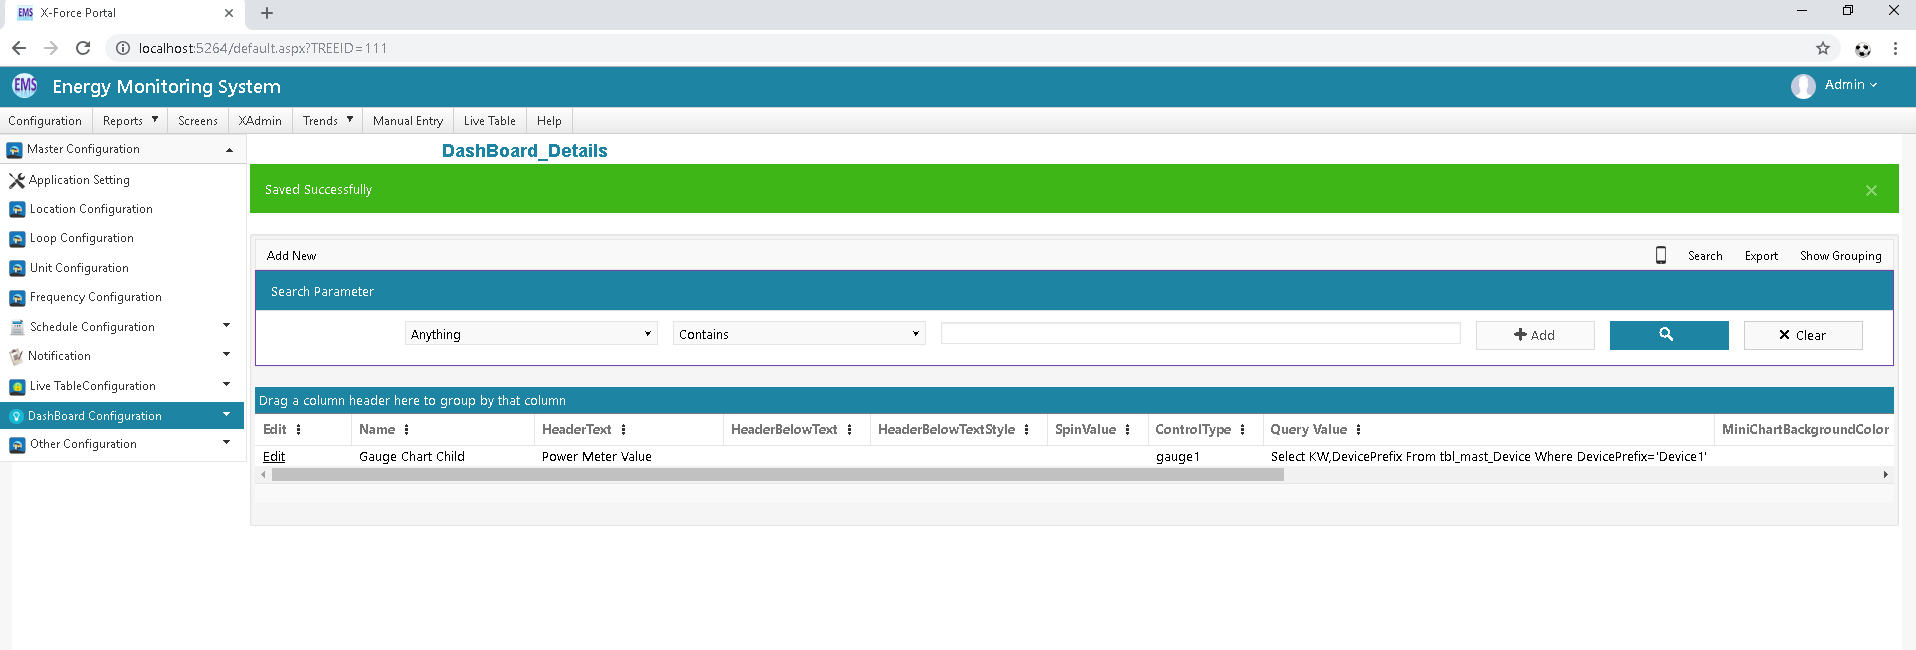
Click on Add Dashboard Detail Respective your Gauge Chart Dashboard . Click On Add New Button.
Click on Save Button
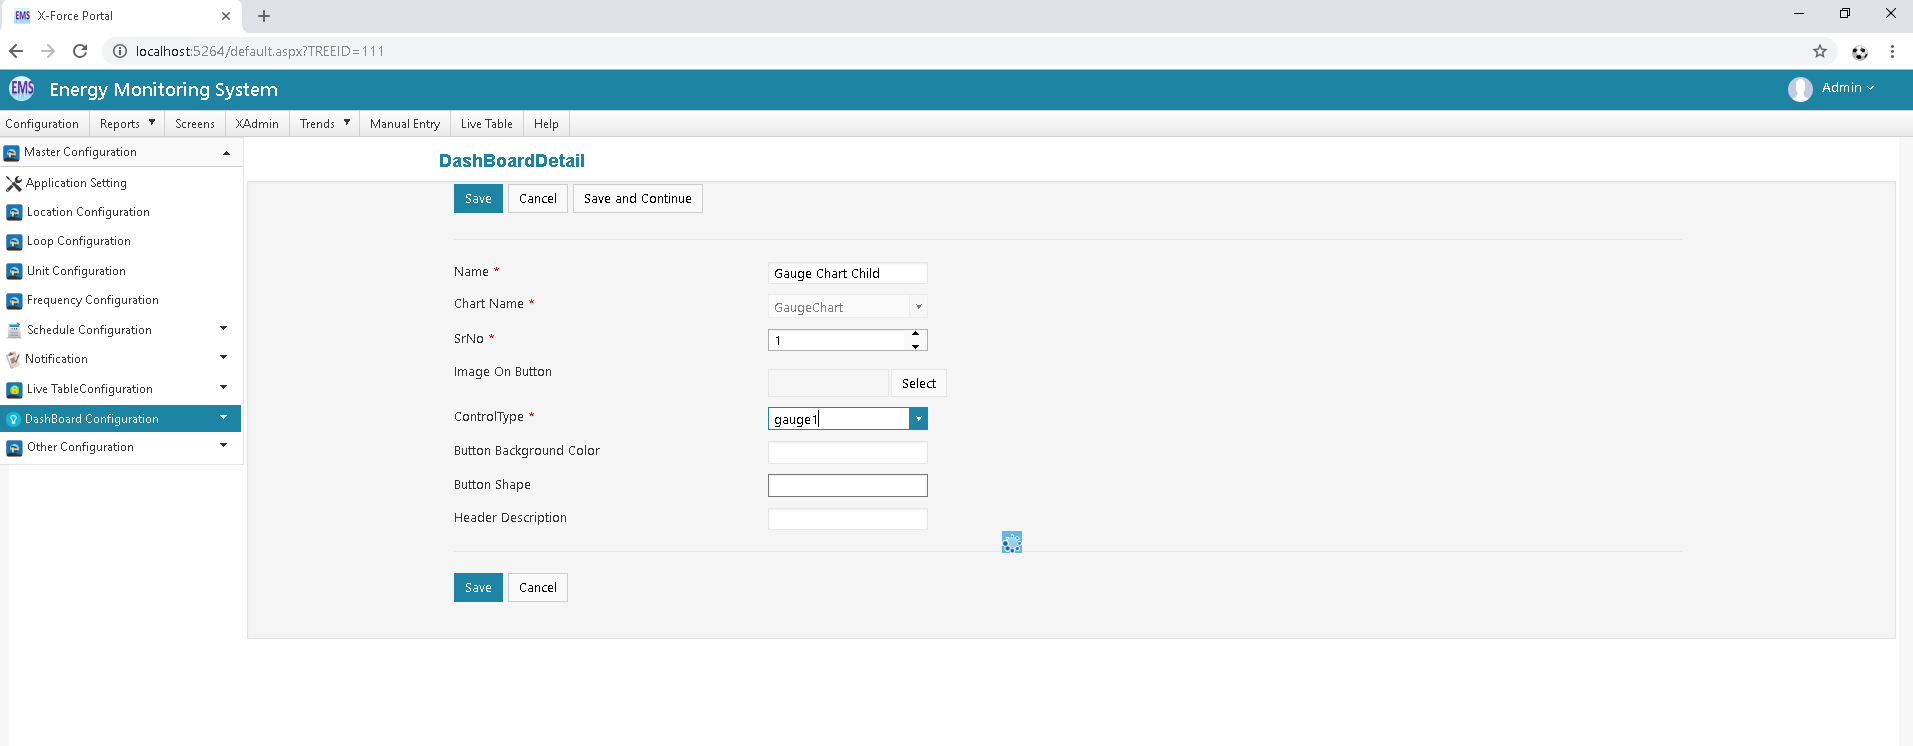
After Select Control Type all Required field Should be display then After Configure all Field.

Click on Save button.
After configure Dashboard Please Create Tree link for your Dashboard.
Go to Tree X-Admin Module Configure Tree For Your Gauge Chart Other Wise Backoffice Database Side You can configure Tree
Node URL: REDIRECT#Dashboard/NewDashboard.aspx?name=GaugeChart
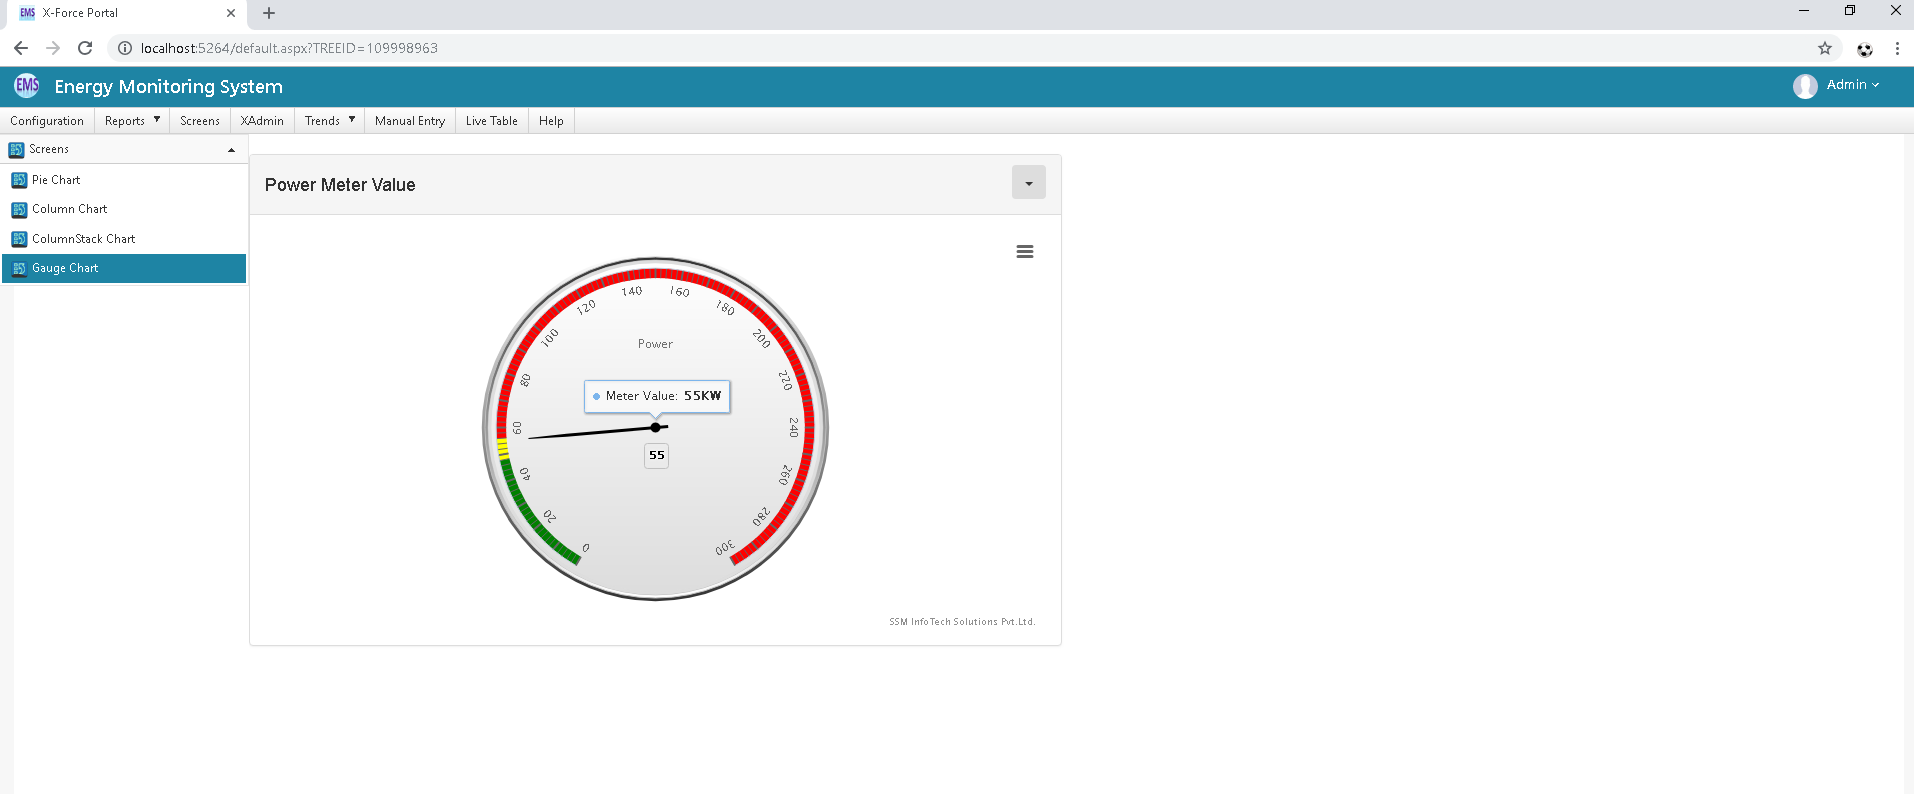
Click on Scree Menu Click ON your chart
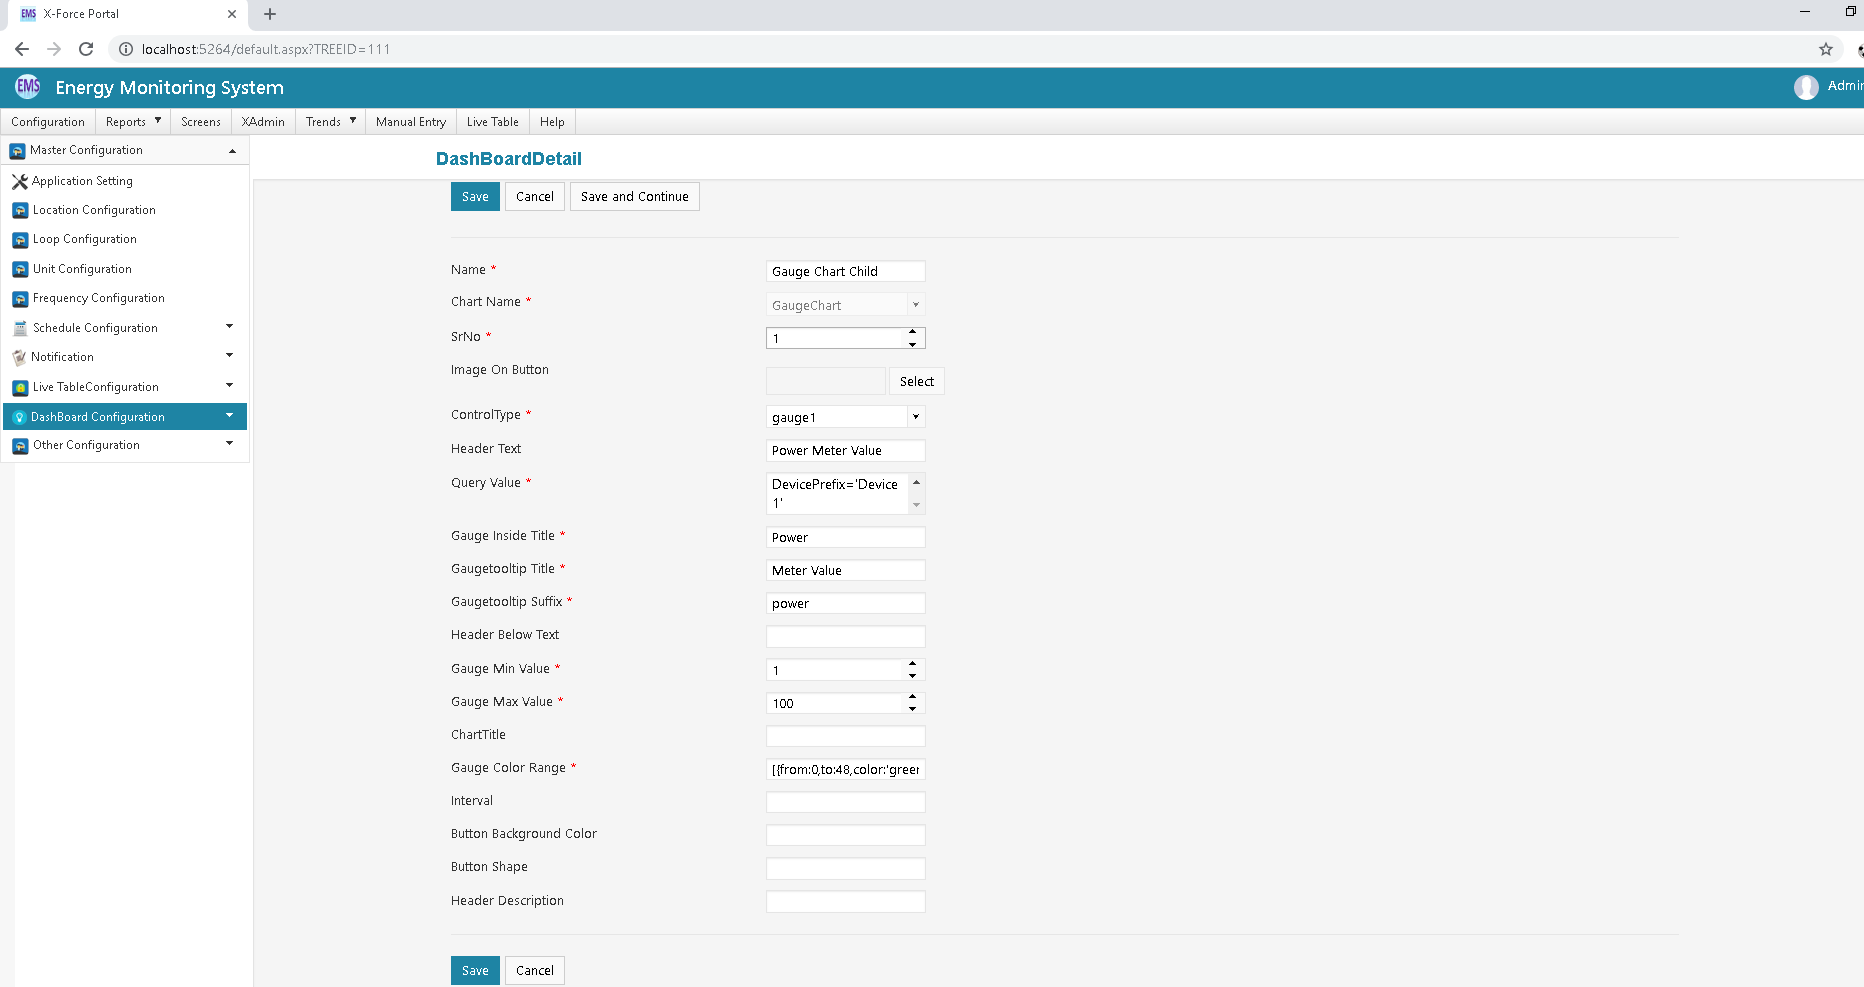
| Sr No | Column | Column Description |
|---|---|---|
| 1 | Chart Name | it should be given meaning full name for chart. |
| 2 | Image on Button | Select suitable image on button. |
| 3 | Control Type | Select control type like Pie chart, bar |
| 4 | Gauge Inside Title | it should be given suitable header text. |
| 5 | Query value | Write query for which type of data you want o show in chart. |
| 6 | Gauge Tooltip Title |
it should has given tooltip title for showing in chart. |
| 7 | Gauge Min Value | Set Minimum value for Gauge chart. |
| 8 | Gauge Max Value | Set Maximum value for Gauge chart. |
| 9 | Chart Title | Set suitable title for Gauge Chart. |
| 10 | Gauge colour Range | It has given Navigation link for redirect that page and showing Chart Data. |
| 11 | Interval | Set interval time between two column. |
| 12 | Header below Text | It should be given Header text below Gauge chart. |
| 13 | Button Background colour | It has given background colour for button. |
| 14 | Button Shape | It has given shape for button like Square,rectangle,round etc. |
Last modified: Friday, 2 August 2019, 12:48 PM