Column Chart
After Click on Add new Button Let's Configure Column chart all Required Field.
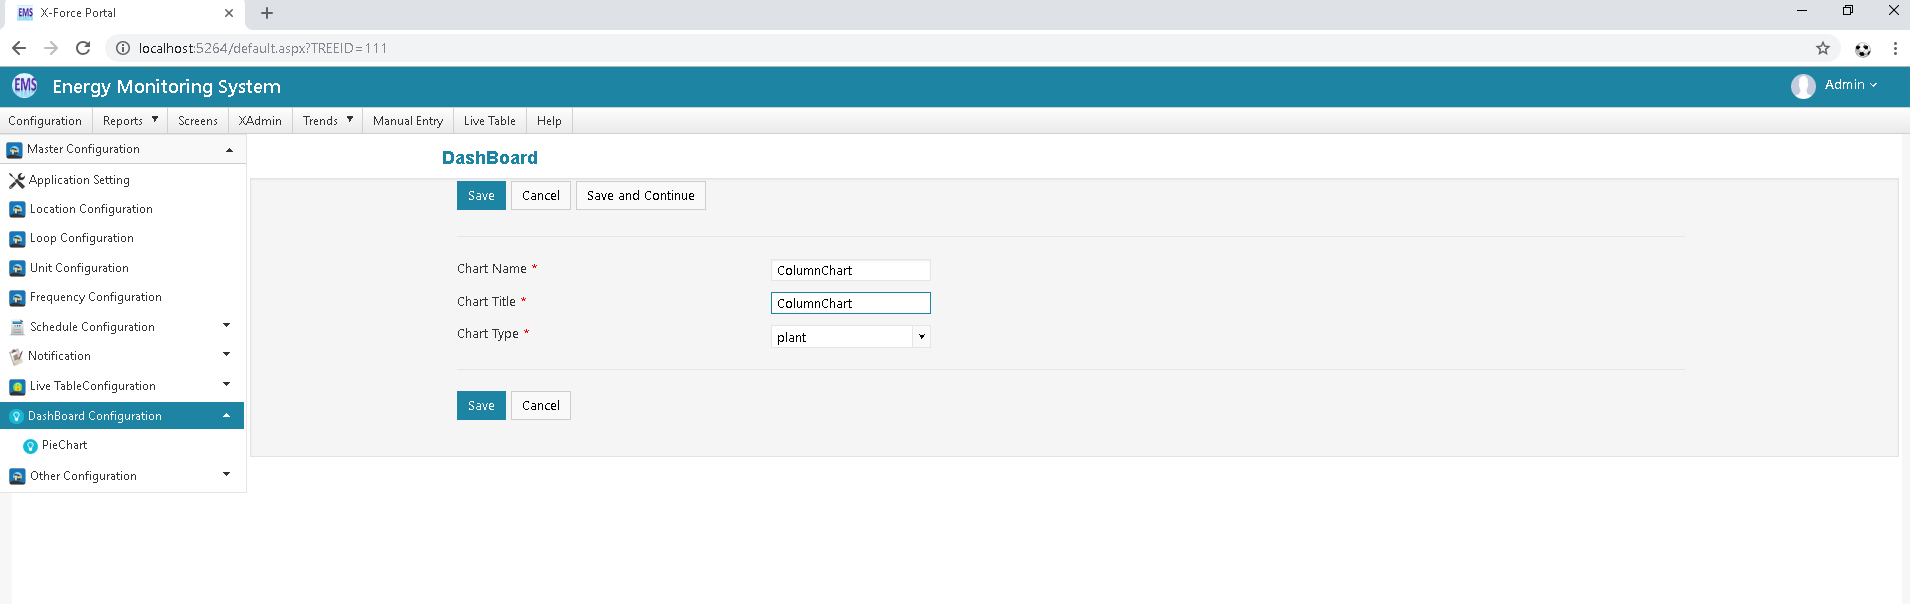
Click on Save Button
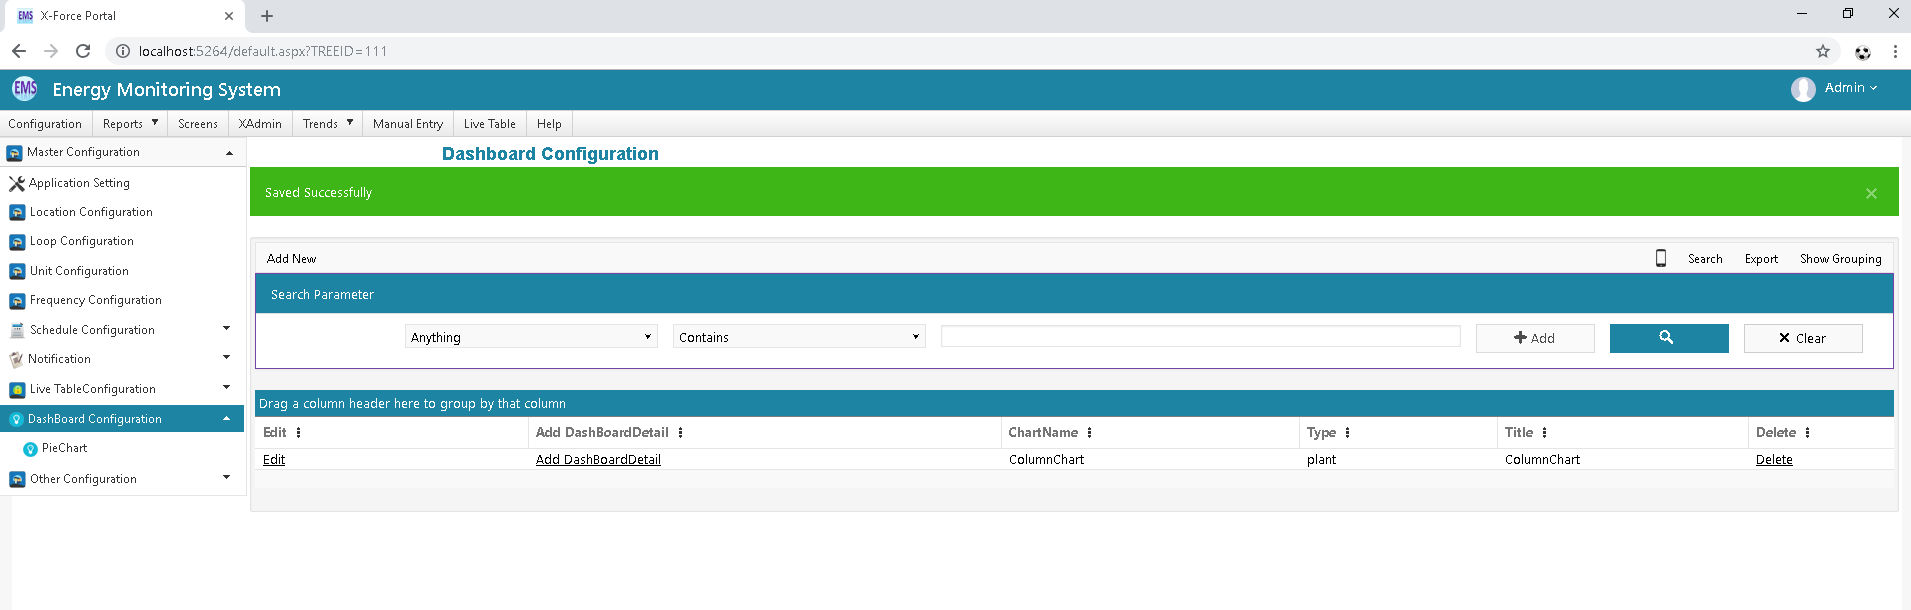
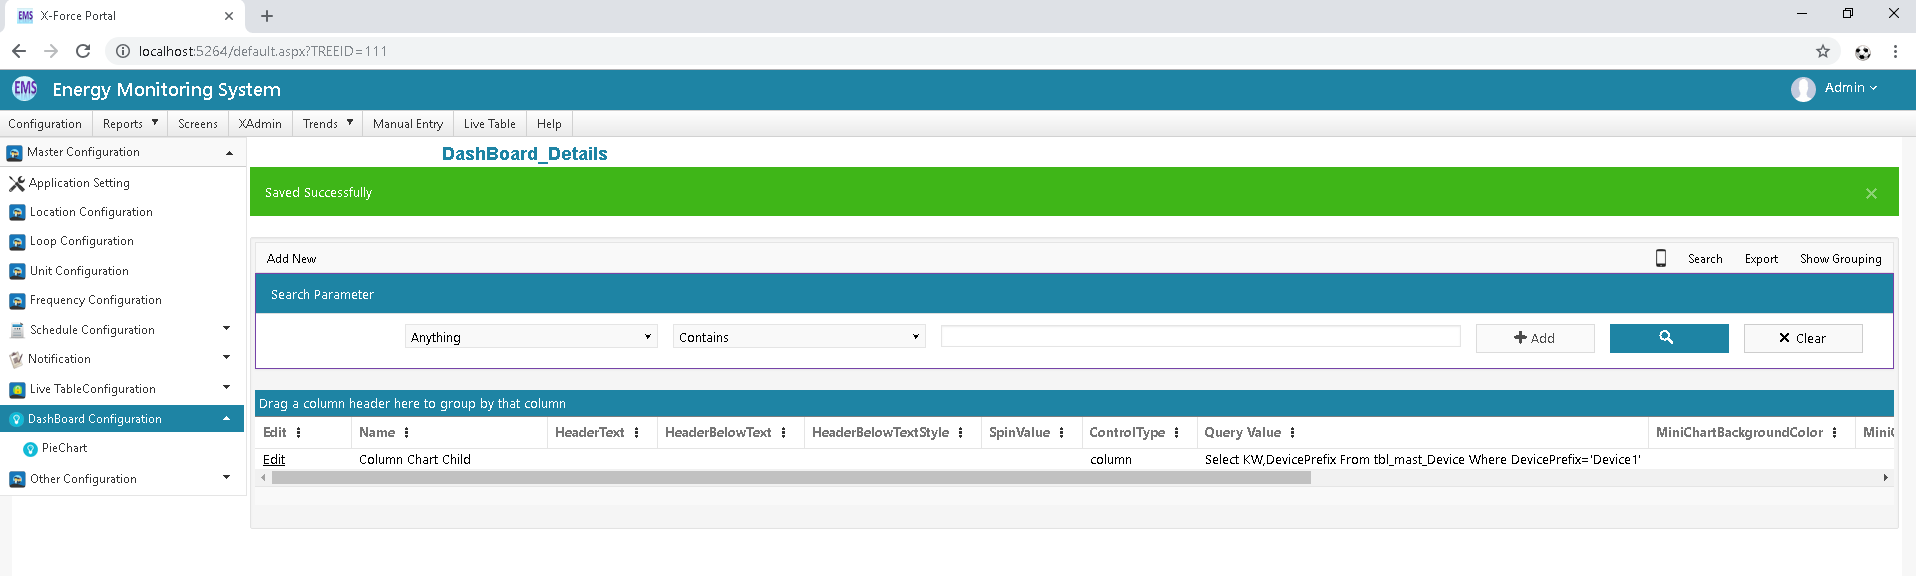
Click on Add Dashboard Detail Respective your Column Chart Dashboard . Click On Add New Button.
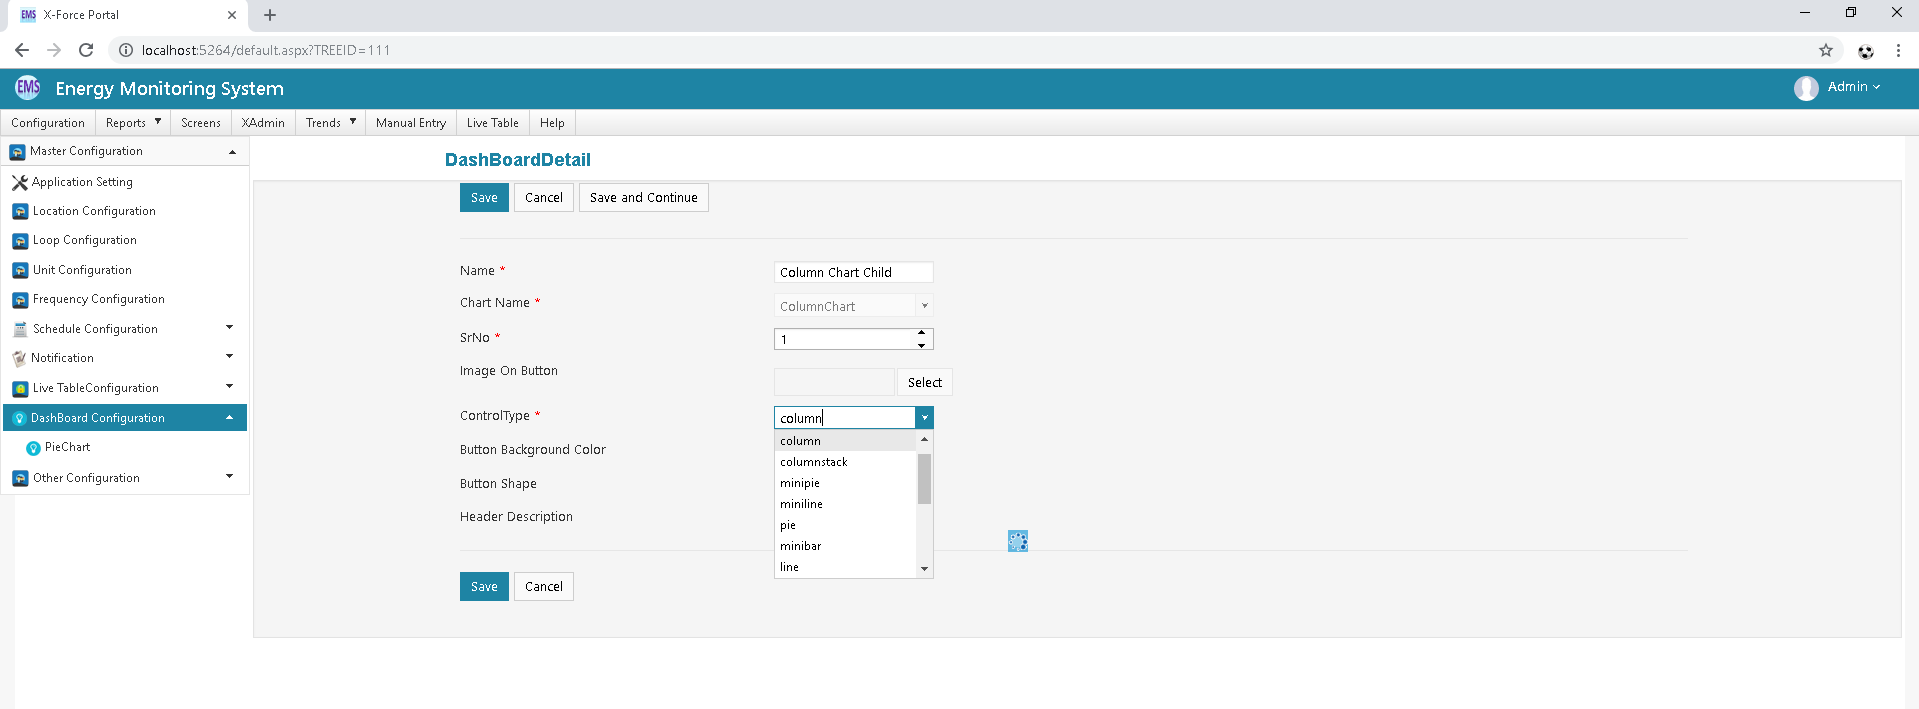
After Select Control Type all Required field Should be display then After Configure all Field.
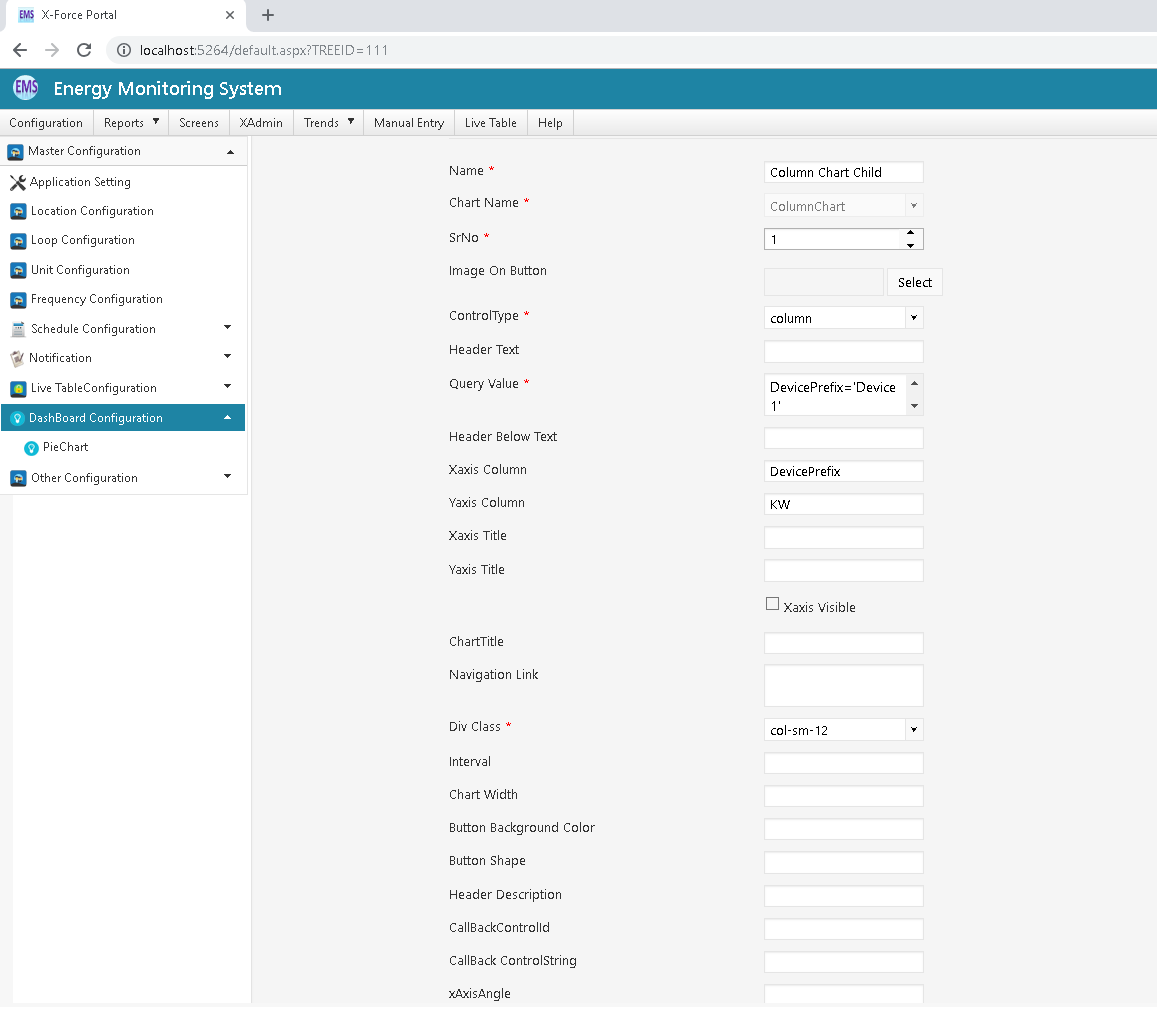
Click on Save button.
After configure Dashboard Please Create Tree link for your Dashboard.
Go to Tree X-Ad min Module Configure Tree For Your Column Chart Other Wise Backoffice Database Side You can configure Tree
Node URL: REDIRECT#Dashboard/NewDashboard.aspx?name=ColumnChart
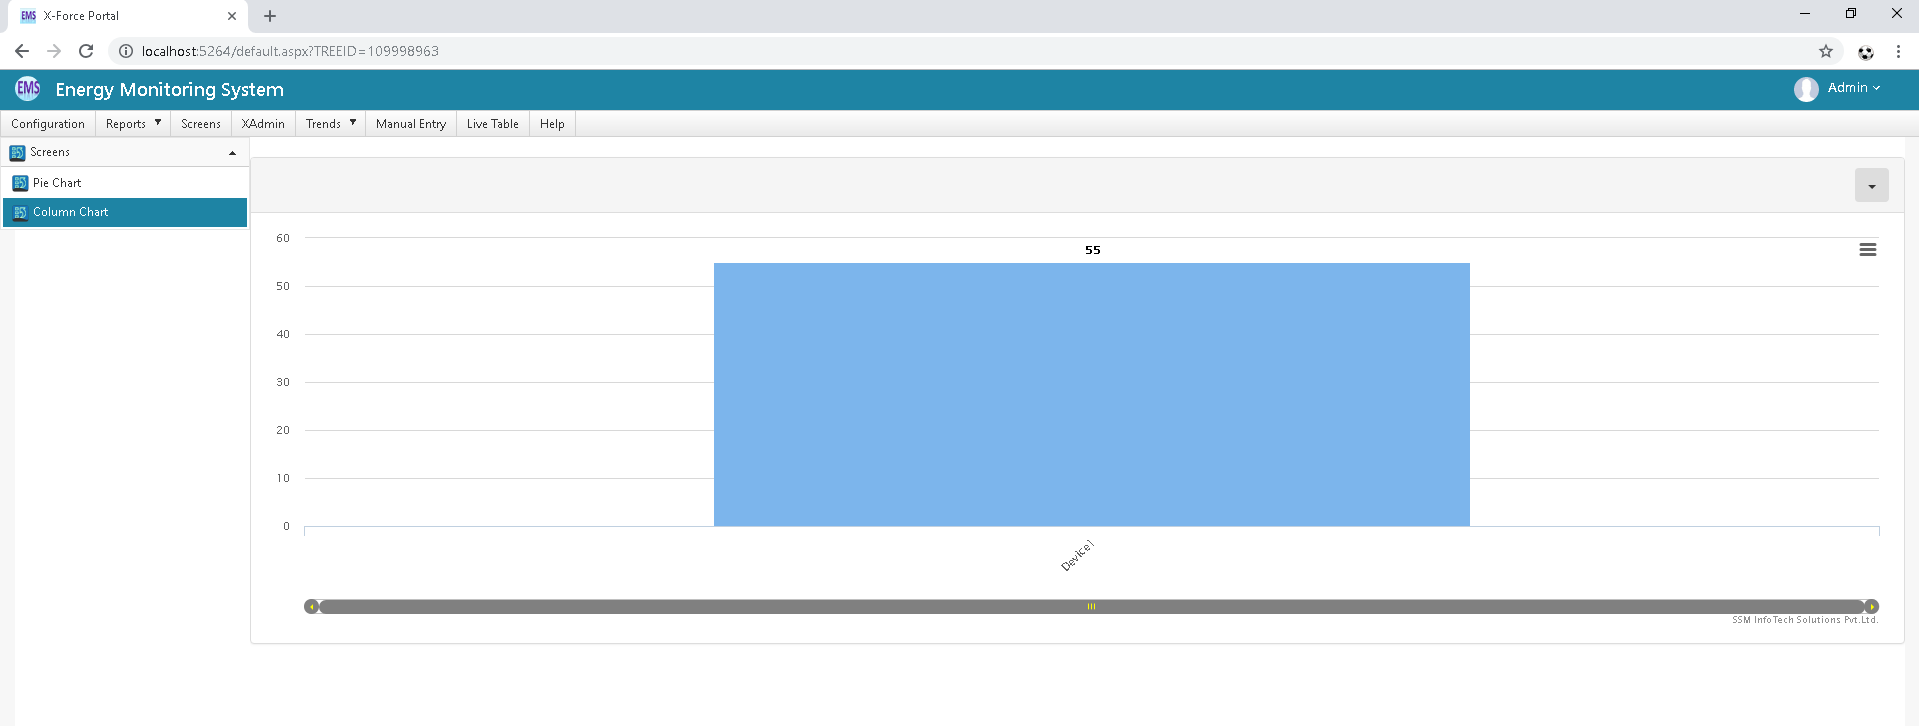
Click on Scree Menu Click ON your chart
| Sr No | Column | Column Description |
|---|---|---|
| 1 | Chart Name | it should be given meaning full name for chart. |
| 2 | Image on Button | Select suitable image on button. |
| 3 | Control Type | Select control type like Pie chart, bar |
| 4 | Header Text | it should be given suitable header text. |
| 5 | Query value | Write query for which type of data you want o show in chart. |
| 6 | Chart Height & Width | it should has height and width of chart. |
| 7 | XaxisColumn | Set Xaxis column value for chart. |
| 8 | YaxisColumn | Set Yaxis column value for chart. |
| 9 | Column Title | Set suitable title for both axis. |
| 10 | Navigation Link | it has given Navigation link for redirect that page and showing Chart Data. |
| 11 | Div Class | Select Div class from list for suitable design |
| 12 | Navigation Target | It should be given Navigation target. |
| 13 | Call Back Control Id | It has given ID for call back control. If something specify code for this chart so you can call from use ID. |
| 14 | Call Back Control String | It has given String for call back control. If something specify code for this chart so you can call from use String. |
Last modified: Friday, 2 August 2019, 11:03 AM