Topic 4.1.1 – Overview
Wonderware Historian Client Query provides a point-and-click interface to construct and analyze the execution of the queries specifically designed for the Wonderware Historian Server.
Wonderware Historian Client Query provides an efficient and simple method to develop both, simple and complex, queries for reporting. This also enables you to build reports to meet custom application requirements. It is also an excellent way to learn the proper syntax for developing queries for the Historian Server.
It is easier to build Structured Query Language (SQL) queries for reporting and custom application requirements by using the Wonderware Historian Client Query’s point-and-click interface. In addition, the query results are immediately available for use. You can also write custom queries if you know SQL syntax and the schema of the database that you are using.
Wonderware Historian Client Query dynamically reconstructs and tests queries as the user makes changes. Query has an easy access to the Historian Server data. Therefore, it provides easy construction of the SQL queries to perform tag searches, obtain tag details and server information, and get current, history, aggregate, summary, and event snapshots values.
By using Wonderware Historian Client Query you can construct queries for use against the Historian Server version 7.1 or later. Wonderware Historian Client Query also uses and understands the Historian Server custom extensions.
Wonderware Historian Client Query enables you to save queries to run at a later time. It also enables you to save the query results.
Query Operation
Numerous distinct query types can be selected from the Query toolbar. These include Custom queries and the Favorites folder queries.
Each query selection results in a different workspace panel selection. The Tag Picker is present for most query types. However, the selection panel for columns changes with the query type.
The Server dialog box contains all the servers that are configured in the Servers list configuration. Changing the selected server in the Server List will cause a corresponding change in the selected server in the Tag Picker, and vice-versa.
The Database selection field is only enabled for the Custom query type. For all other queries, the selected database is fixed to be the Runtime database.
Start Query
Open Wonderware Historian Client Query (Start | All Programs | Wonderware | Historian Client
| Query).
Before this client application can be used to query tag information from the database, the server must be running and you must have access to the server.
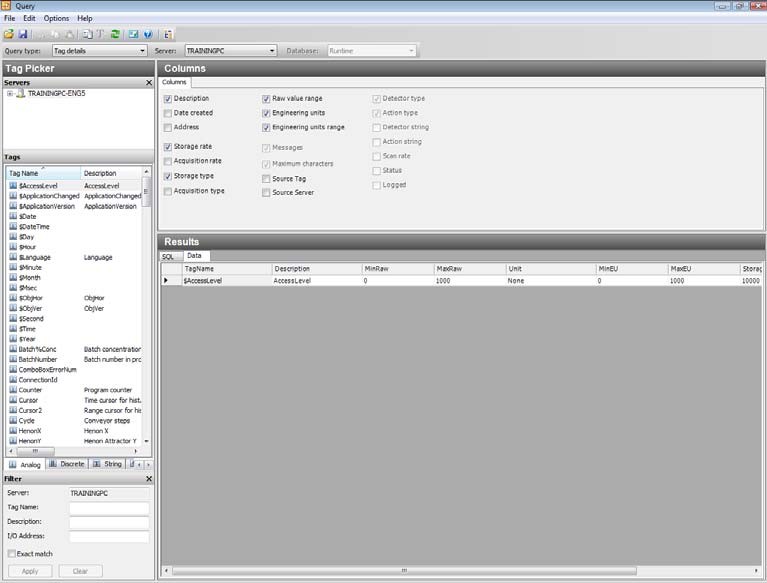
Query Interface
Wonderware Historian Client Query consists of the following interface elements:
- Main Toolbar
- Query Toolbar
- Tag Picker
- Columns Pane
- Results Pane
Query Toolbar
The Query toolbar is used to select the query type, server, and database for the query. The Server drop-down list contains the list of the connected servers. The Database drop-down list is only available if the Query type is Custom.

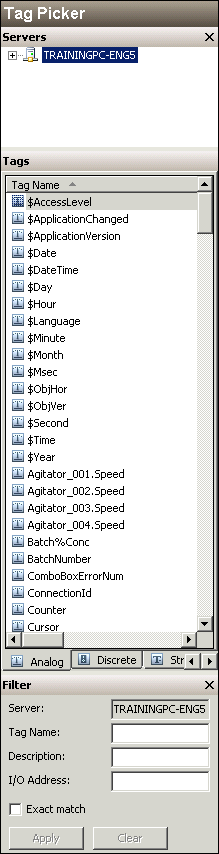
Tag Picker
Tag Picker shows the tag groups and tags that exist in the database. It shows all the tags that are visible to the currently logged in user, based on his or her permissions.
Using Tag Picker, you can quickly search the database for tags of a certain type and for tags that match a particular search pattern. You can then select the ones that you want to include for the client application or control.
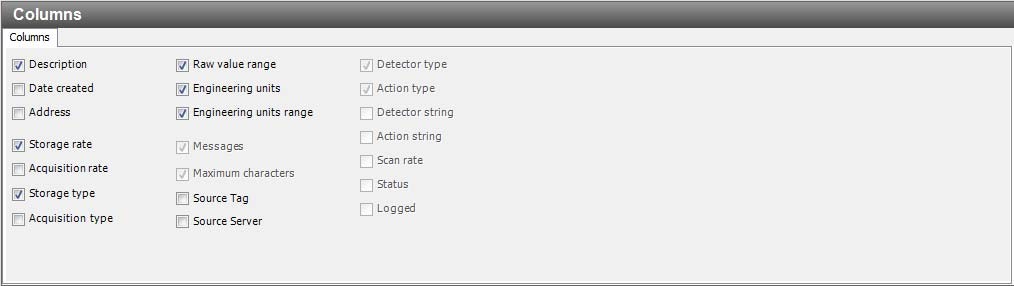
Columns Pane
The Columns pane is used to select the details for the query.
Results Pane
The Results pane is used to view the results of the queries that have been created. The Results
pane includes two tabs:
- SQL tab – The SQL tab shows the actual SQL statement that is sent to the server
- Data tab – The Data tab shows the data returned by the SQL statement

Build Queries
Wonderware Historian Client Query Columns pane displays different tabs, depending on the type of query selected. Each tab provides various relevant configuration options to build your query.
The query results are displayed in the Results pane Data tab. The results change dynamically whenever the query is redefined.
The Refresh query button on the Main toolbar is used to refresh your results.

As each of these options is chosen, the SQL being constructed can be viewed in the window when the Query tab is selected. The query will change as each option is selected.
View Constructed Queries
You can also keep a record of all the queries constructed. To keep a record of all queries, you need to select the All queries option from the Options menu.
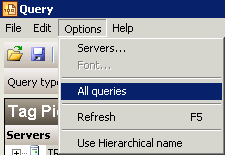
A third tab named All queries appears.
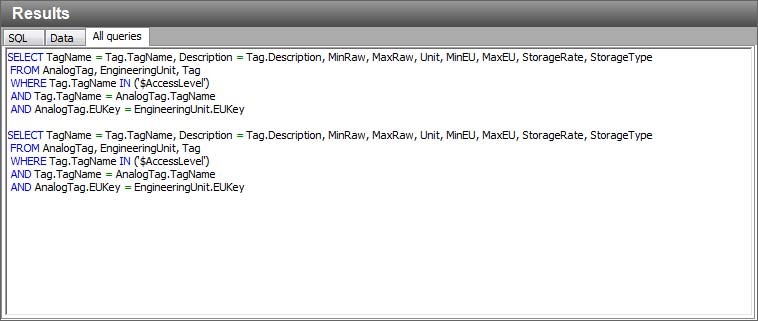
Once this option is enabled, all queries constructed can be viewed in the window of this tab.
Configuration Options
You can also modify the font face of a query. To modify the font face of a query, do the following:
Click anywhere inside the SQL tab.
Step 1. On the Main toolbar, click Configure the font.

The Font dialog box appears.
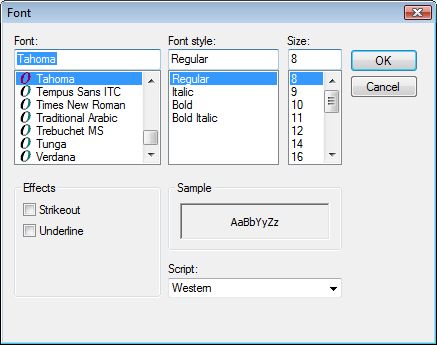
Step 2. Select the required font type and size and click OK.
Last modified: Thursday, 4 July 2019, 1:46 PM