Lab 4.1 – Using Retrieval Styles and Data Transformations Part 1
Use Standard Retrieval Styles
Step 1. Create a new trend.
Step 2. In the Tags pane, select the ReactLevel tag drag it to the Tag List.
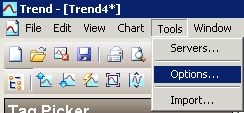
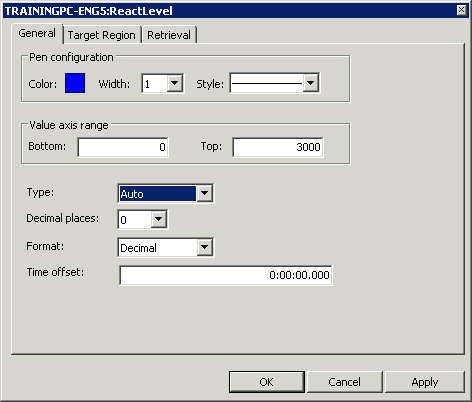
Step 3.Right-click the ReactLevel tag, and select Configure.
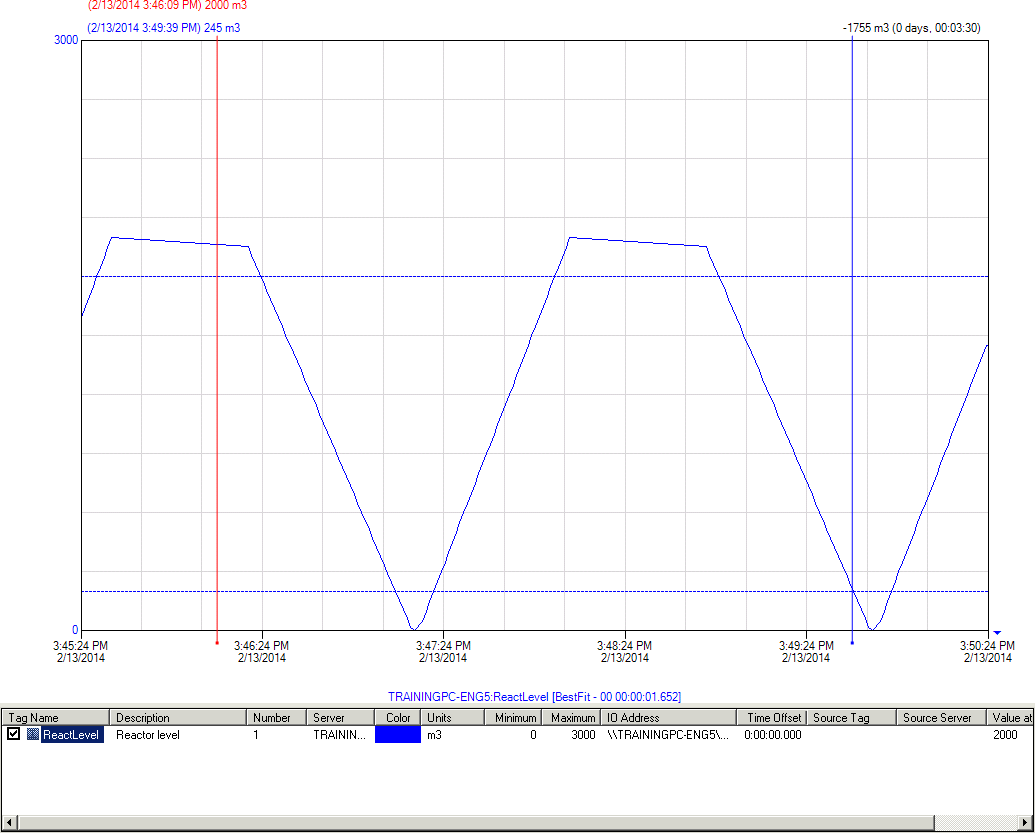
Step 4. In the Width drop-down list, click 4.
Step 5. In the Type drop-down list, click Point.
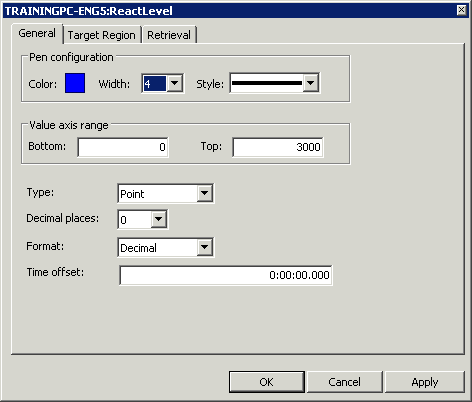
Step 6. Click OK.
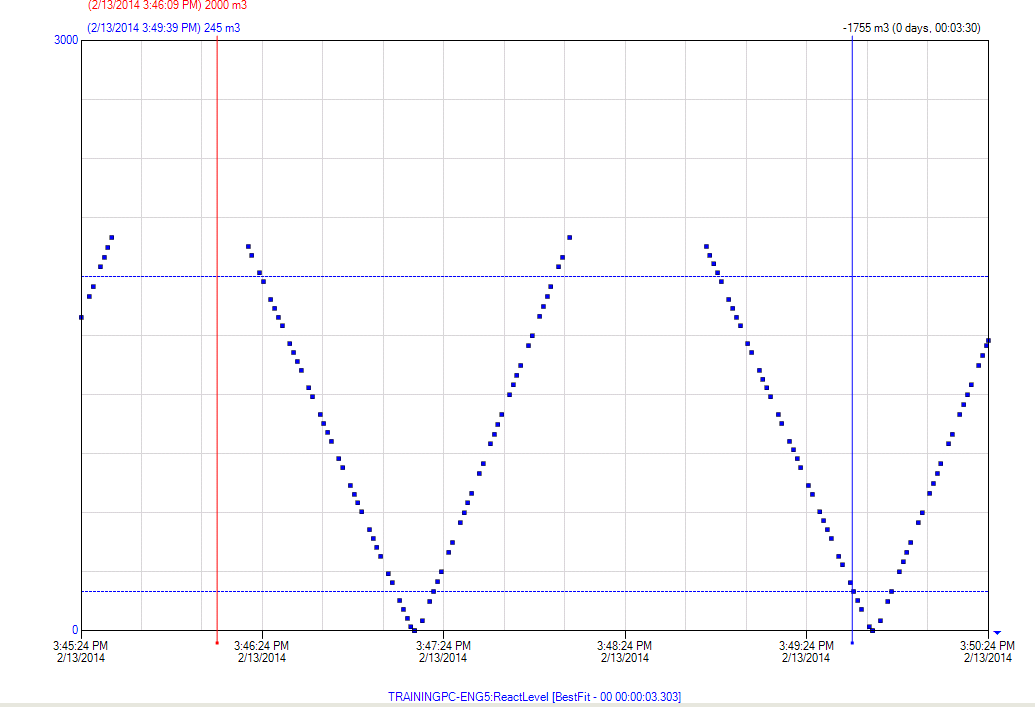
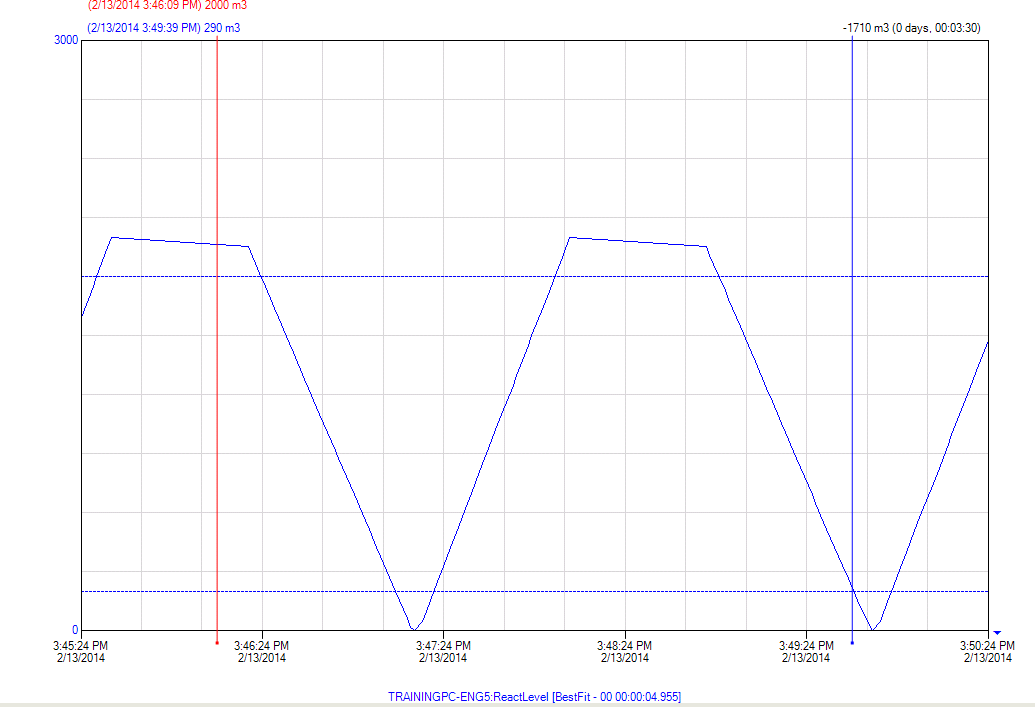
The trend should look similar to the following:
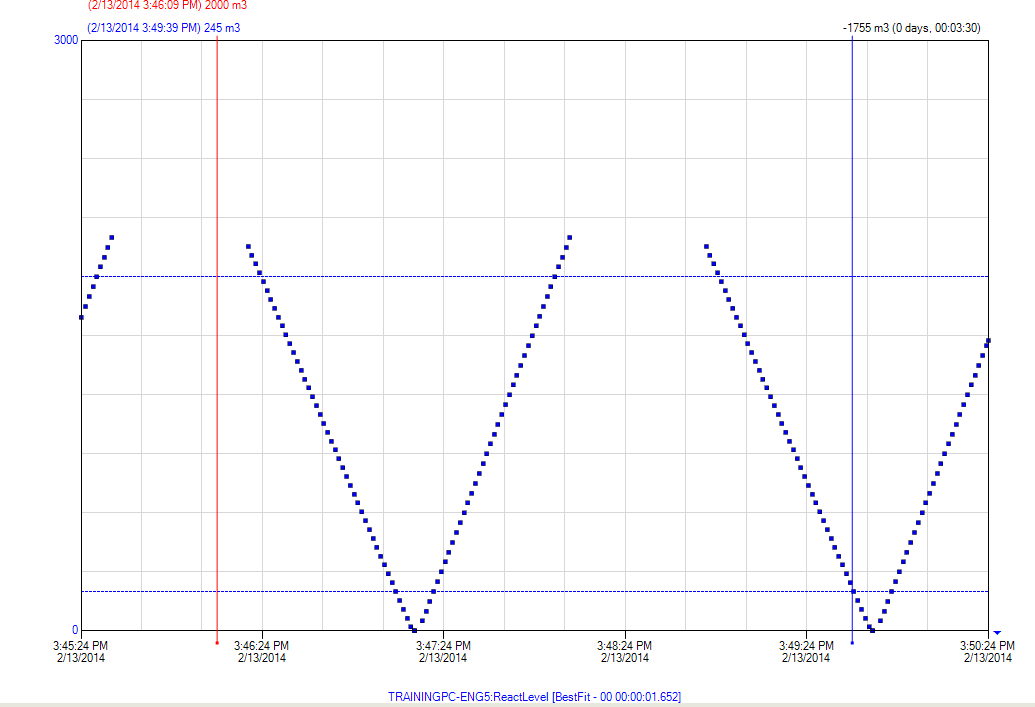
Step 7. On the Tools menu, click Options.
Step 7. On the Tools menu, click Options.
The Options dialog box appears.
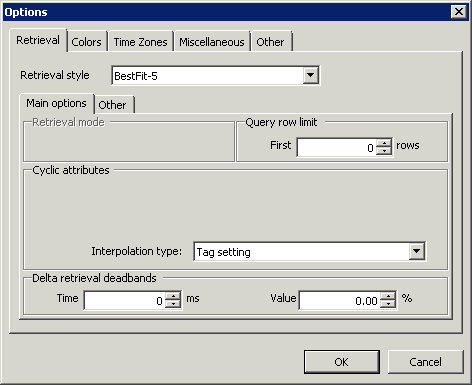
The Retrieval tab appears by default. Notice that the Retrieval style is BestFit-5. This means that Wonderware Historian Client Trend queried the data using the BestFit-5 retrieval mode, that is, with one cycle every 5 pixels.
Step 8. In the Retrieval style drop-down list, click BestFit-10.
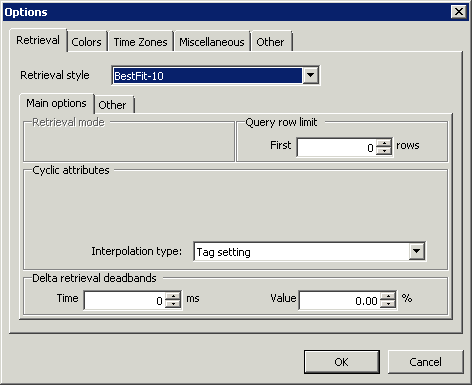
Step 9. Click OK.
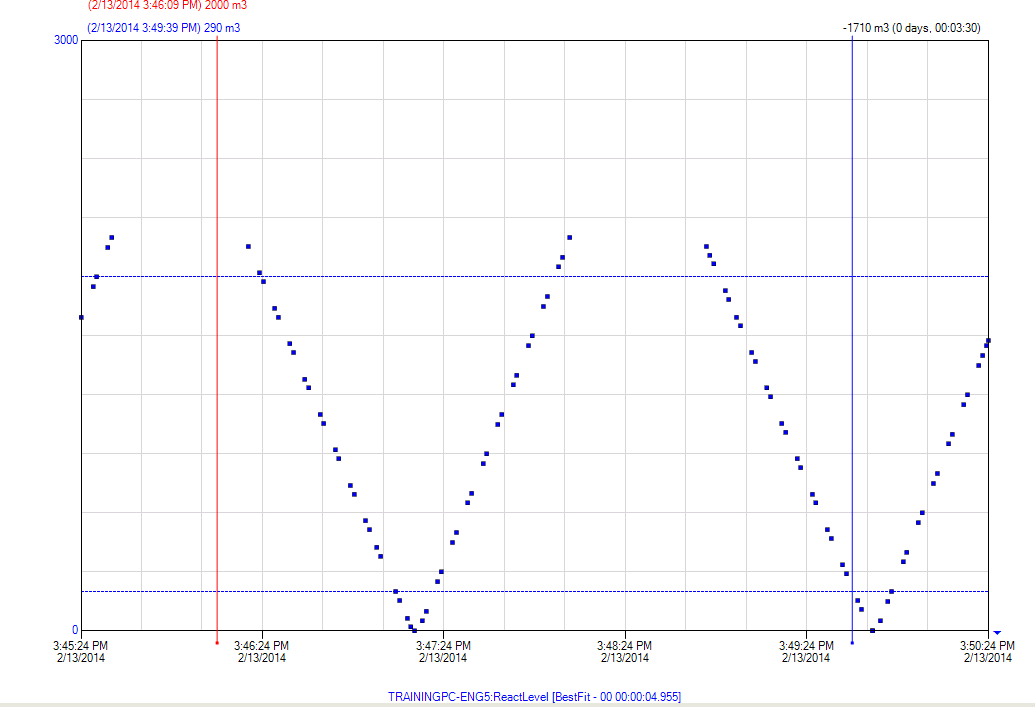
Notice the difference in the tag trace. The interval for the BestFit-10 retrieval mode is 10 pixels instead of 5. Therefore, fewer data points are retrieved.
Step 10. On the Tools menu, click Options.
Step 11. In the Options dialog box Retrieval style drop-down list, click BestFit-15.

Step 12. Click OK.
The data is queried using the BestFit-15 retrieval mode, with one cycle every 15 pixels, resulting in even fewer data points being retrieved.
Step 13. Right-click the ReactLevel tag, and click Configure.
Step 14. In the Width drop-down list, click 1.
Step 15. In the Type drop-down list, click Auto.
Step 16. Click OK.
The trend chart displays the Type Auto based on the tag’s effective interpolation setting, which is specified in the retrieval settings of Wonderware Historian Client Trend.
Override the Retrieval Style at the Tag Level
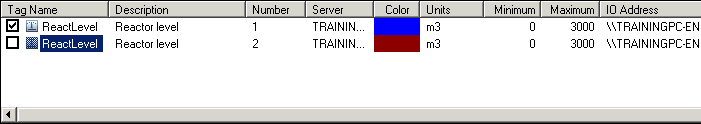
You will now add a second instance of the ReactLevel tag and override the Retrieval Style.
Step 17. In the Tags pane, select the ReactLevel tag and drag it to the Tag List.
This will add another instance of the ReactLevel tag to the current trend chart.
Step 18. Right-click the first instance of ReactLevel, and click Configure.
Step 19. Click the Retrieval tab.
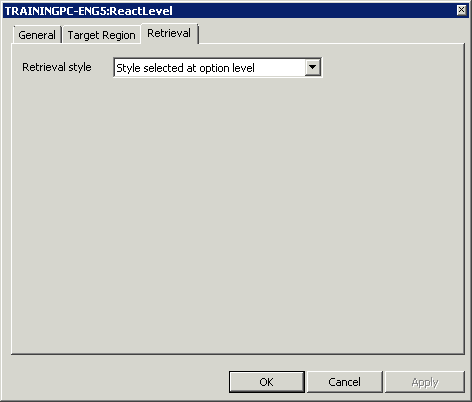
Step 20. In the Retrieval style drop-down list, click Cyclic (ActiveFactory 9.1).
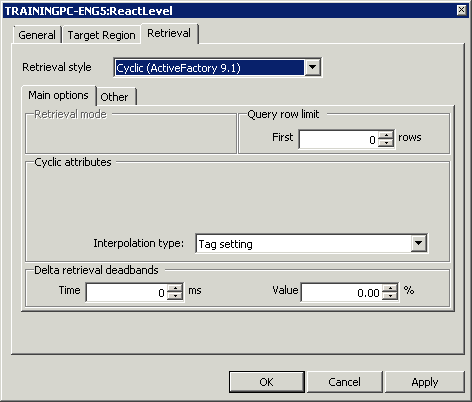
Step 21. Click OK.
Step 22. The signals still look very similar, however the amount of data being retrieved is substantially different. The data log will show this difference. In the Tag list, uncheck the second instance of the ReactLevel tag.
Step 22. The signals still look very similar, however the amount of data being retrieved is substantially different. The data log will show this difference. In the Tag list, uncheck the second instance of the ReactLevel tag.
Step 23. On the Main toolbar, click View the data log in narrow format.
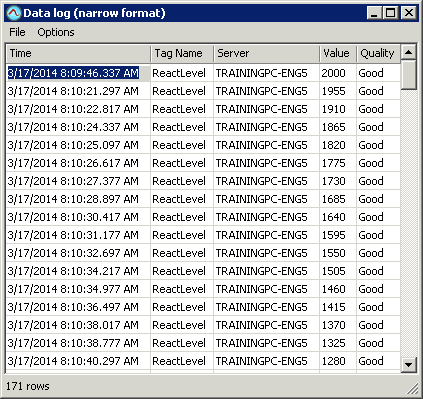
Data displayed in the Data log window represents the history data retrieved by Historian Client in
order to plot the trend. Notice how many rows are returned in the Data log window.
Step 24.Close the Data log window.
Step 25. In the Tag List, uncheck the first instance of the ReactLevel tag, and check the second instance of the ReactLevel tag.
Step 26. On the Main toolbar, click View the data log in narrow format.
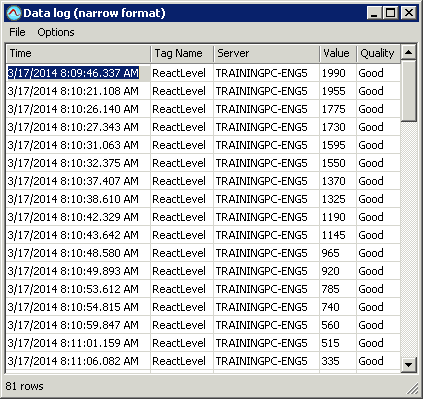
Notice that fewer rows are retrieved here, than for the first instance of the tag.
Step 27. Close the Data log window.
Step 28.In the Tag list, check the first instance of ReactLevel so that both of the tag traces display in the trend chart.
Last modified: Thursday, 4 July 2019, 1:52 PM