Lab 7 – Using the Tag Analysis Wizard
Use the Tag Analysis Wizard
Step 1. Create a new workbook.
Step 2. Click the Historian menu.
Step 3. On the Historian menu ribbon, click Tag Analysis.
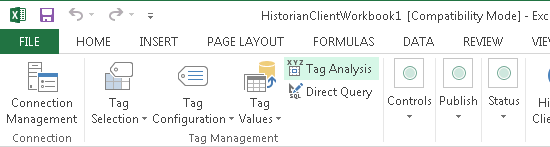
The Tag Analysis wizard appears.
Step 4. In the Select type of analysis list, click Scatter analysis.
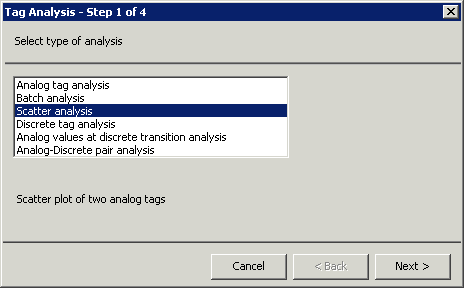
Step 5. Click Next.
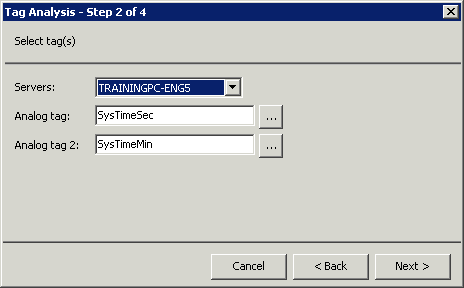
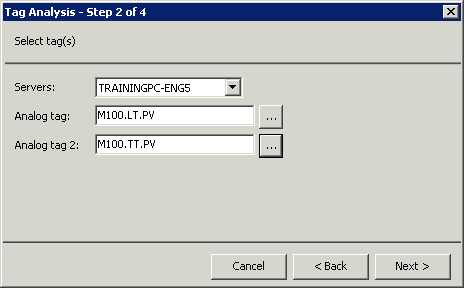
Step 6. In the Tag Analysis - Step 2 of 4 dialog box, ensure that the Servers drop-down list displays the name of your Historian Server.
Step 7. Next to the Analog tag field, click the Ellipsis button to change the tag.
The Select tag dialog box appears.
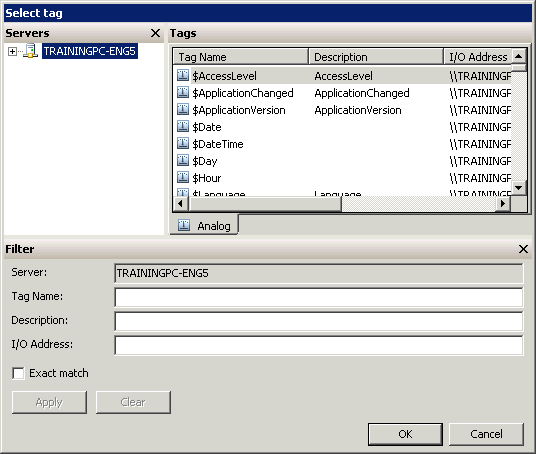
Step 8. In the Tags pane, find and select M100.LT.PV.
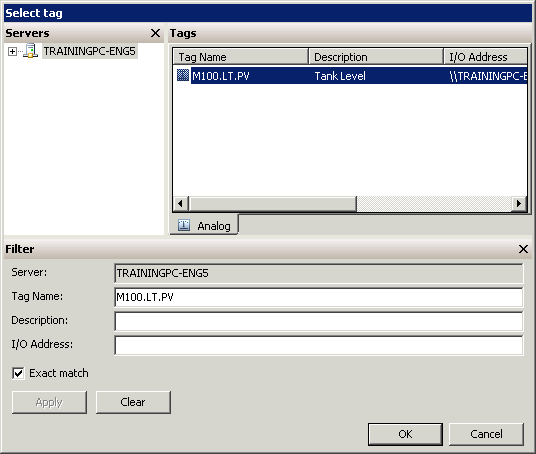
Step 9. Click OK.
Step 10. In the Tag Analysis - Step 2 of 4 dialog box, next to the Analog tag 2 field, click the Ellipsis button.
Step 11. In the Select tag dialog box, locate and select the M100.TT.PV tag.
Step 12. Click OK.
Step 13. Click Next.
The Tag Analysis - Step 3 of 4 dialog box appears.Step 14. In the Starting time field, retain the default date and time.
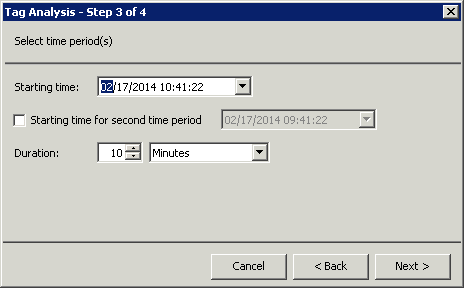
Step 15. Click Next.
The Tag Analysis - Step 4 of 4 dialog box appears.
For this lab, retain the default values.
Step 16. Click Finish.
A new worksheet is created and the input tags are inserted into column A.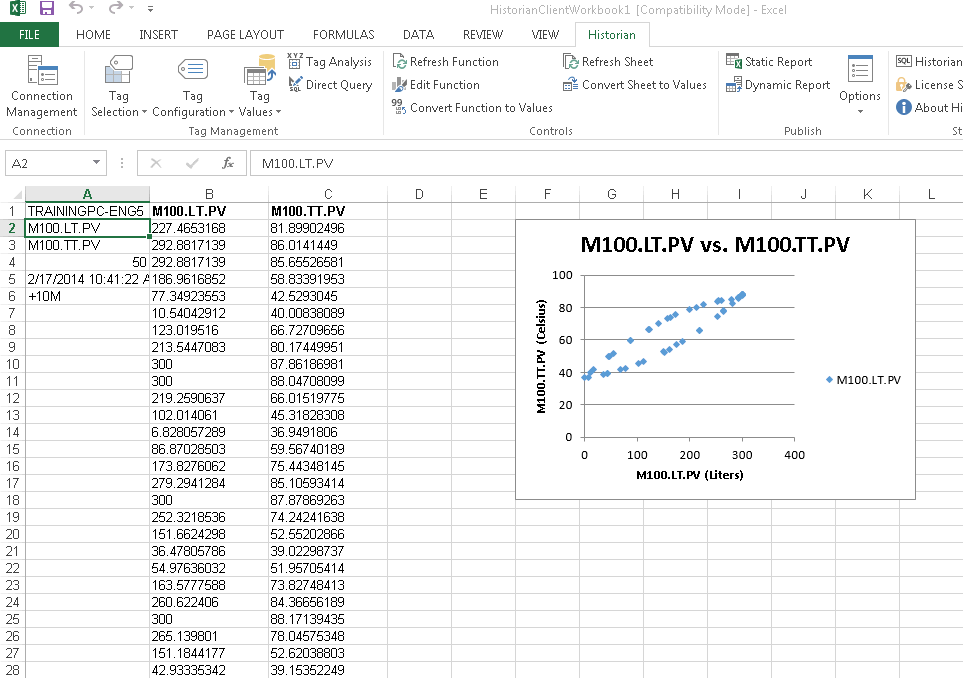
Analog Tag Analysis
Through Analog tag analysis you can create graphs and trends, calculate statistics, and return information regarding configuration and limits.
Step 17. On the Historian menu ribbon, click Tag Analysis. The Tag Analysis - Step 1 of 5 dialog box appears.
Step 18. In the Select type of analysis list, click Analog tag analysis.
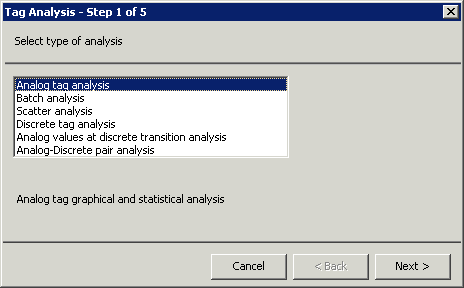
Step 19. Click Next.
The Tag Analysis - Step 2 of 5 dialog box appears.
Step 20. In the Analog tag field, retain the default value of M100.LT.PV.
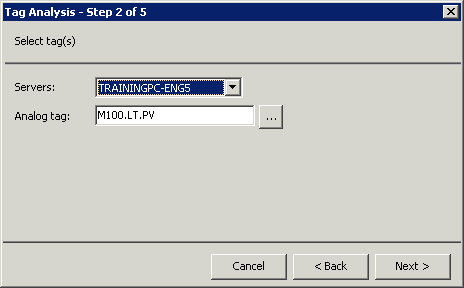
Step 21. Click Next.
The Tag Analysis - Step 3 of 5 dialog box appears.
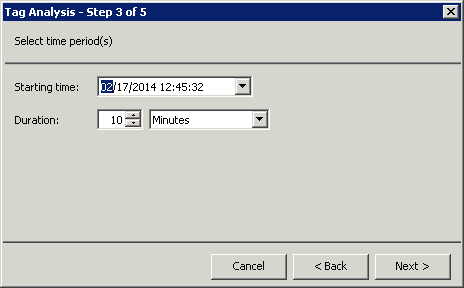
Step 22. Retain the default values and click Next.
The Tag Analysis - Step 4 of 5 dialog box appears.
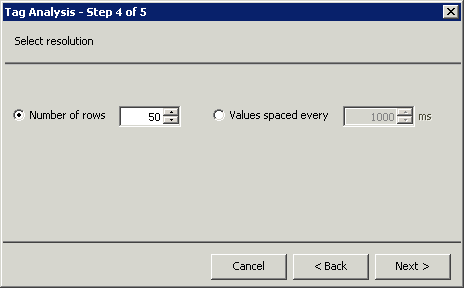
Step 23. Retain the default values and click Next.
The Tag Analysis - Step 5 of 5 dialog box appears.
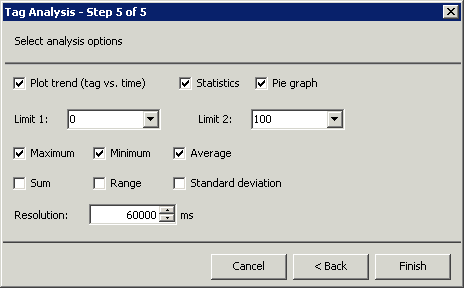
Step 24. In the Limit 1 field, enter 25.
Step 25. In the Limit 2 field, enter 80.
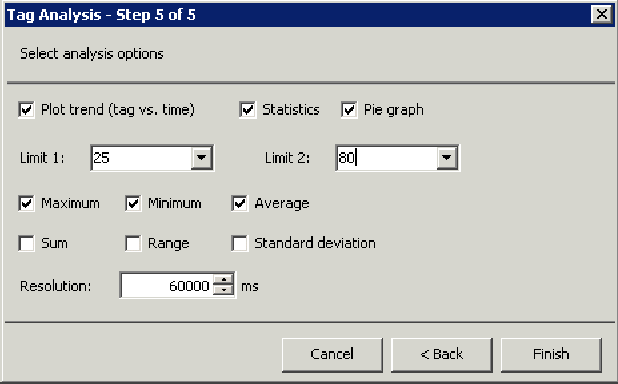
Step 26. Click Finish.
The worksheet displays the tag graph, trends, statistics, and information regarding configuration and limits.
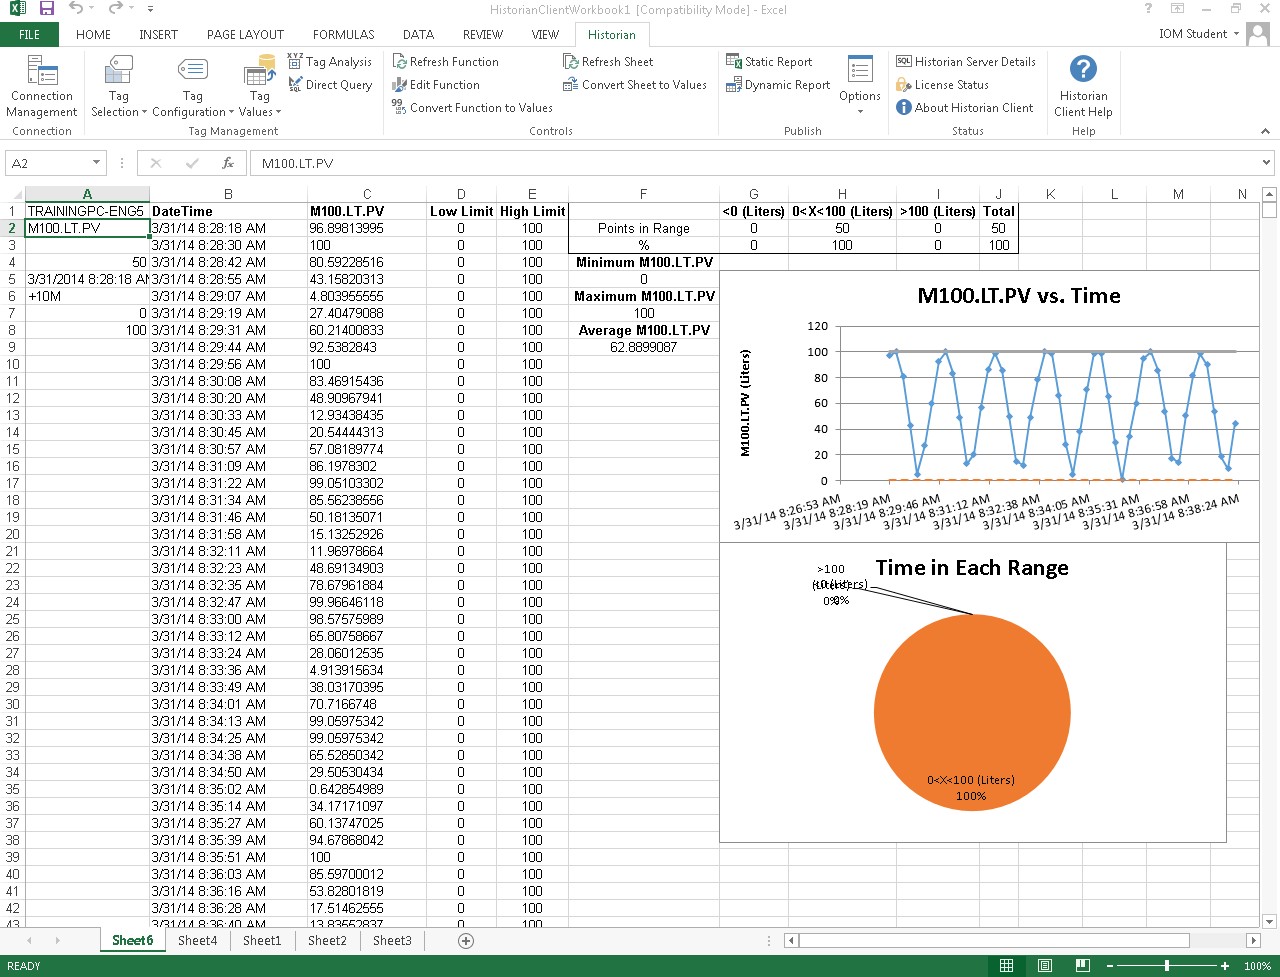
Step 27. Save the report as TagAnalysis.xlsx in the C:\Training folder and close the workbook.
Last modified: Thursday, 4 July 2019, 1:51 PM