Lab 3 – Configuring Time Offsets and Target Regions
Configure Time Offset
Step 1. Create a new trend.
Step 2. In the Tags pane, select the M100.LT.PV tag.
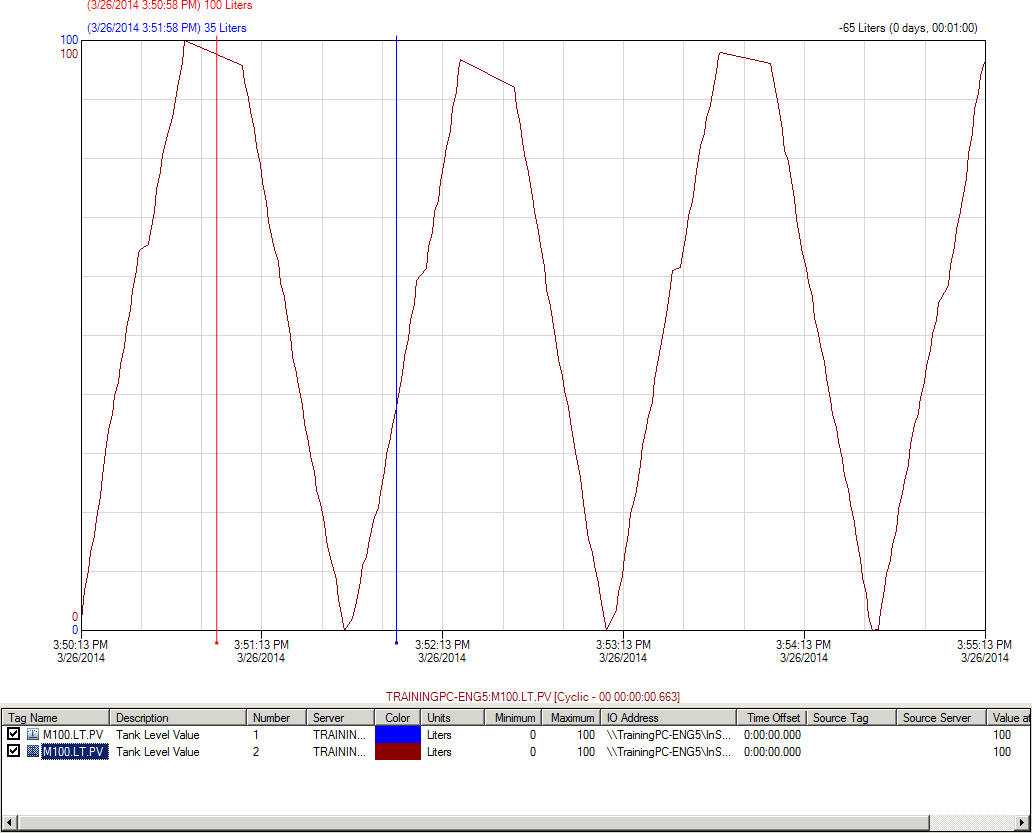
Step 3. Drag the selected M100.LT.PV tag to the Tag List twice to add two instances of the M100.LT.PV tag to the trend chart.
Both of the tags will display identical traces.
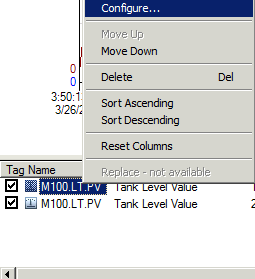
Step 4. In the Tag list, right-click the first instance of the M100.LT.PV tag, and click Configure.
Step 5. In the Time offset field, change the value to –0:00:10.000 seconds.
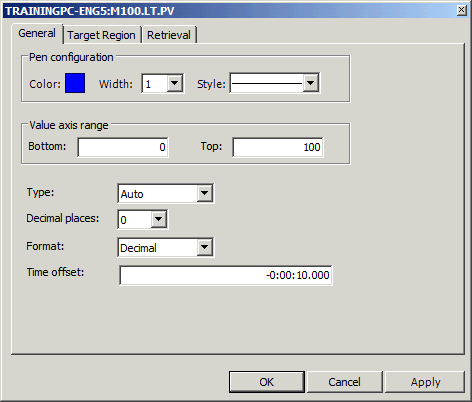
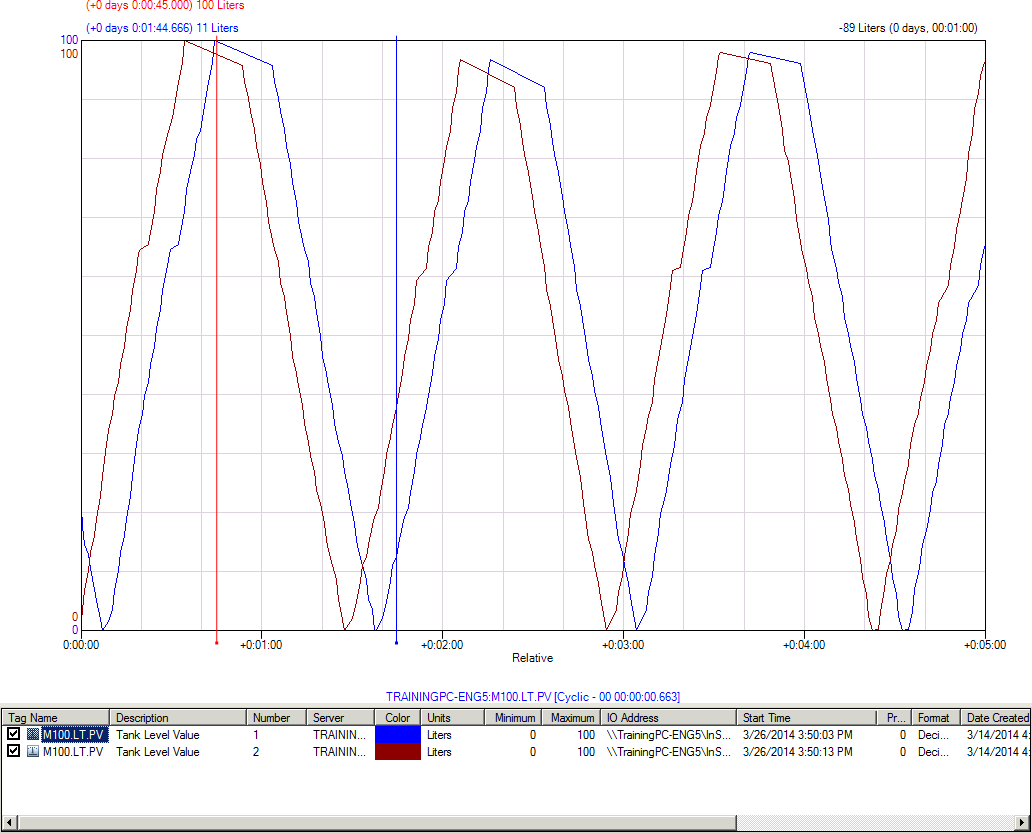
Step 6. Click OK.
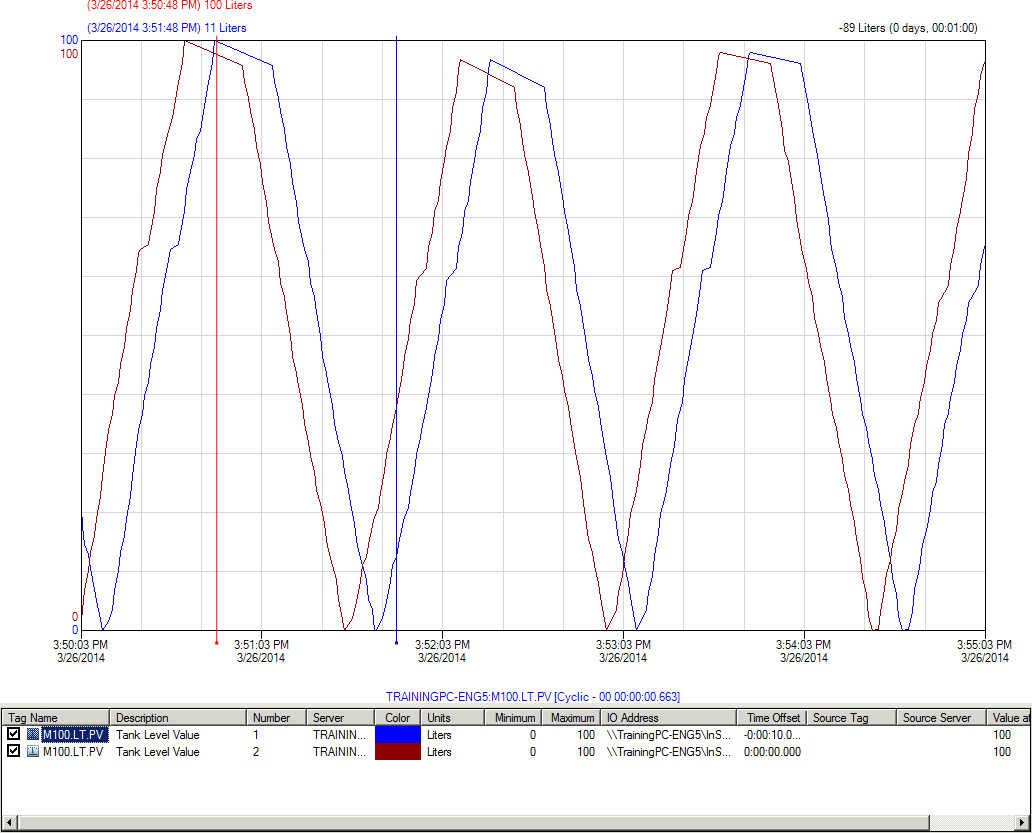
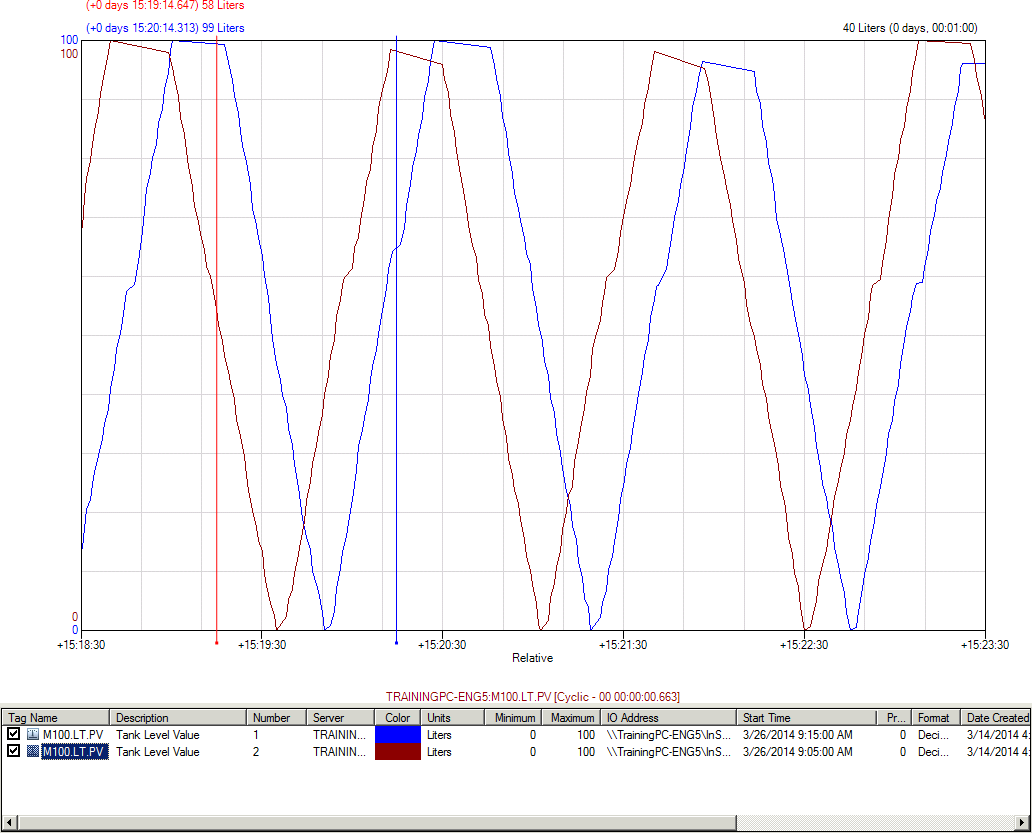
The traces appear with the configured offset.
Analyze Signals Using Relative Time
Step 7. On the View menu, click Relative Time.
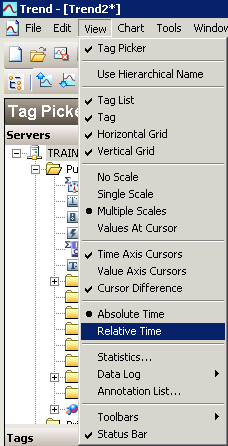
Notice that the trend axes now show relative time, rather than absolute time. The time displayed is relative to the start time displayed in the Tag list under the trend chart.
Step 8. In the Tag list, right-click the first instance of M100.LT.PV tag, and click Configure.
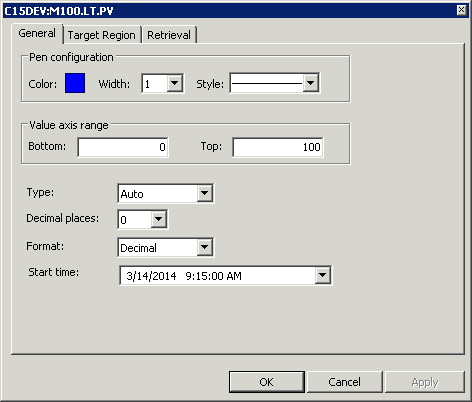
Step 9. Change the value in the Start time field to a time in the recent past relative to class time. For example: today at 9:15 AM.
Step 10. Click OK.
In the Tag list, the first instance of the M100.LT.PV tag displays the manually set Start time.
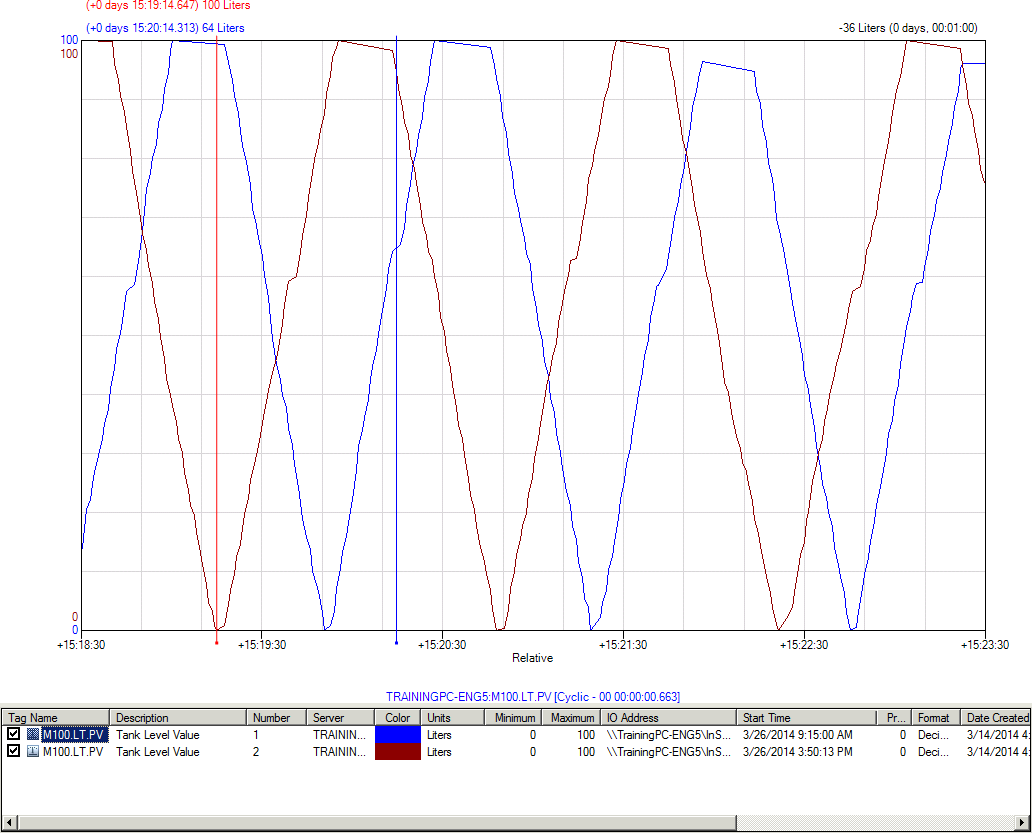
Step 11. Configure the second instance of the tag with a start time that is 10 minutes earlier than the first tag.
For example: today at 9:05 AM.
Step 12. Save the trend as Relative Time.aaTrend to the C:\Training folder and close the trend file.
Define a Target Region
For each analog, discrete, or summary tag in a trend, you can define a target region. The target region is a highlighted area of the chart into which tag values should fall during normal operation. Values that fall outside of these normal limits can be highlighted in a special color, making it easy to detect them.
Step 13. Open the XYScatterplot.aaTrend file created in Lab 1.
Step 14. In the Tag list, right-click the ReactLevel tag, and click Configure.
Step 15. Click the Target Region tab.
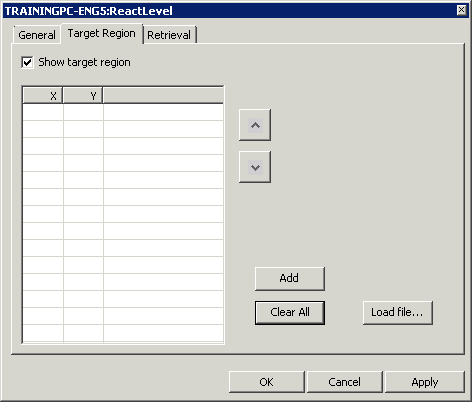
Step 16. Click Add.
In the X and Y fields, double-click the cells and enter the coordinates provided in the table below. After each coordinate pair is entered, click Add to enter a new pair.
|
X |
Y |
|
10 |
2050 |
|
10 |
950 |
|
55 |
0 |
|
95 |
–55 |
|
180 |
1600 |
|
180 |
2050 |
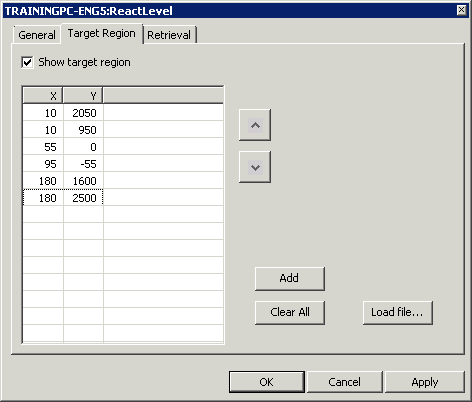
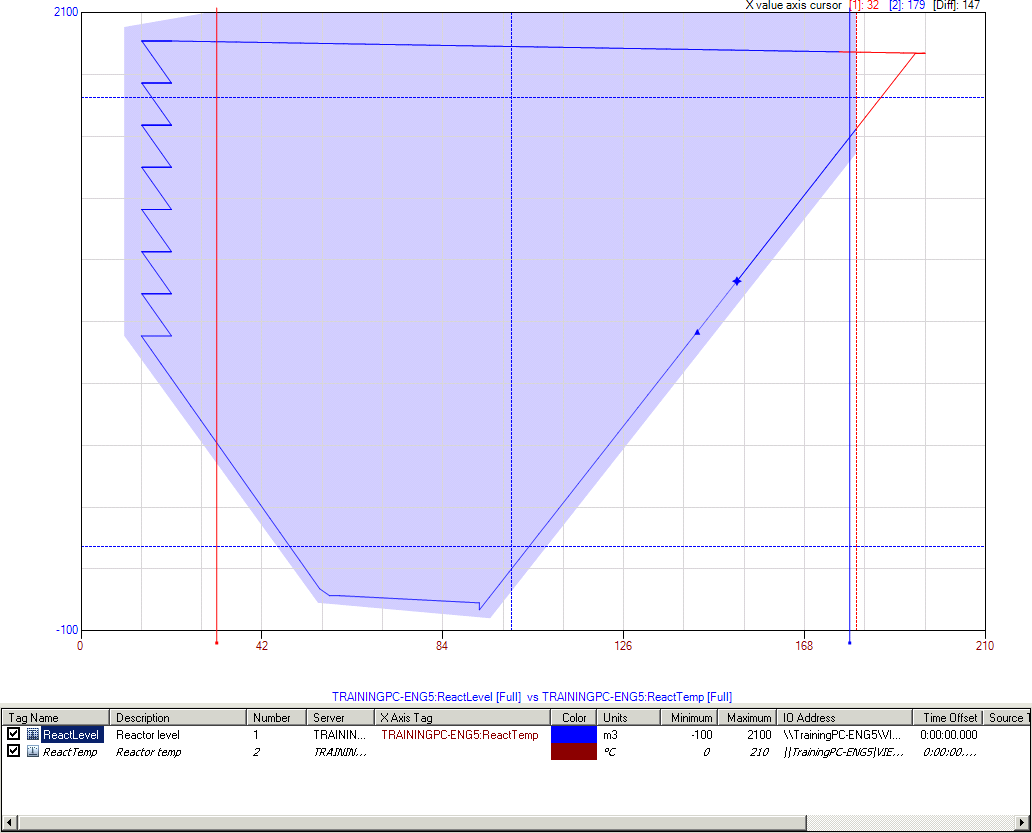
Step 18. Click OK.
The trend chart displays the highlighted defined target region.
Step 19. Save and close the trend file.
Last modified: Thursday, 4 July 2019, 1:52 PM