Lab 1 – Using Wonderware Historian Client Trend Basic Functions
Connect to the Historian Server
The Wonderware Historian Client maintains an active connection with the Wonderware Historian Server. When the Historian Client Trend is opened it automatically uses this connection, if possible.
Step 1. Open Wonderware Historian Client Trend (Start | All Programs | Wonderware | Historian Client | Trend).
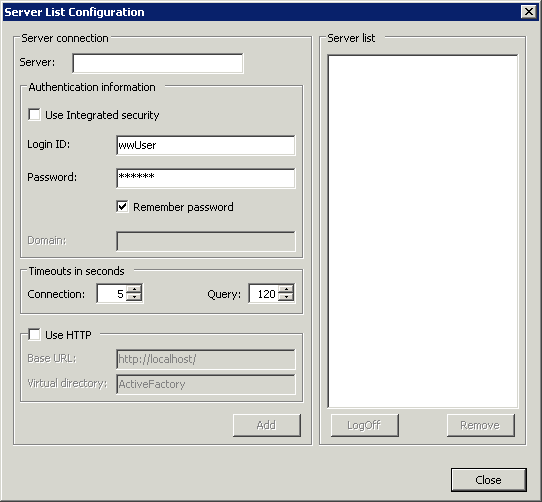
Step 2. In the Server field, enter the name of the Historian Server assigned to you.
Step 3. Check the Use Integrated security checkbox.
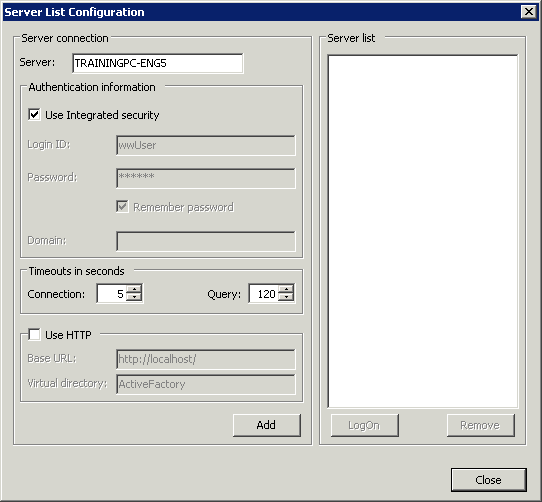
Step 4. Click Add.
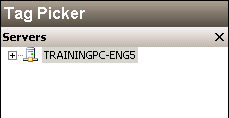
The server appears in the Server list pane.
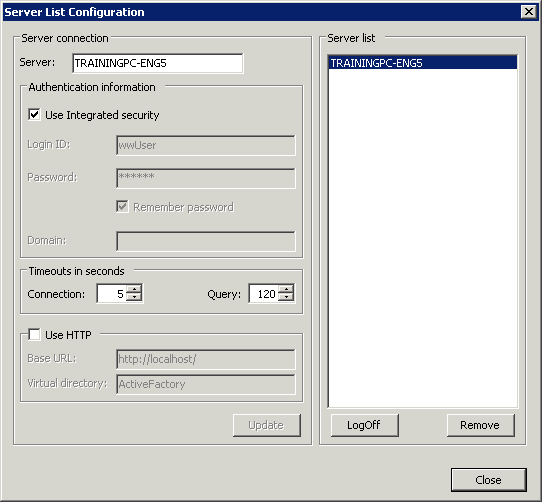
Step 5. Click Close.
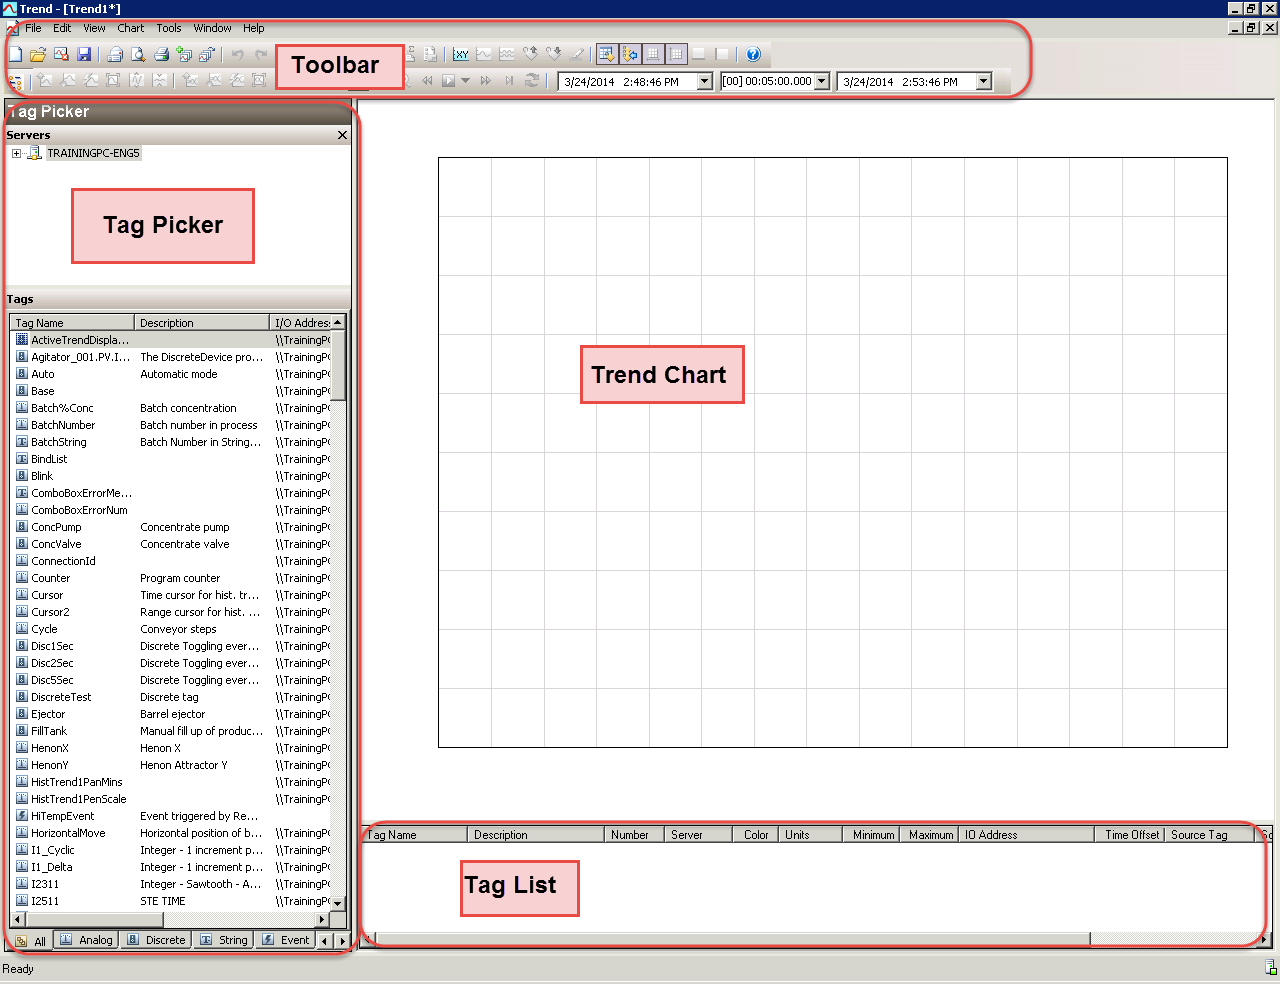
You are now connected to the Historian Server and the Wonderware Historian Client Trend
window appears.
Create a New Trend
You will now create a new Trend to view historical data.
Step 6. In the Tag Picker, Servers pane, click the Historian Server.
The tags appear within the Tags pane.
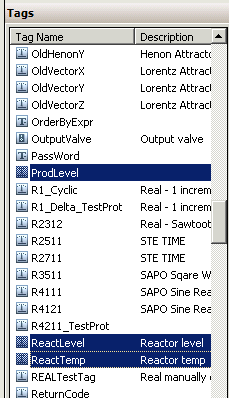
Step 7. In the Tags pane, select the ProdLevel, ReactLevel, and ReactTemp tags.
Note:Hold down the Ctrl key to select multiple tags.
Step 8. Drag the selected tags to the Tag list.
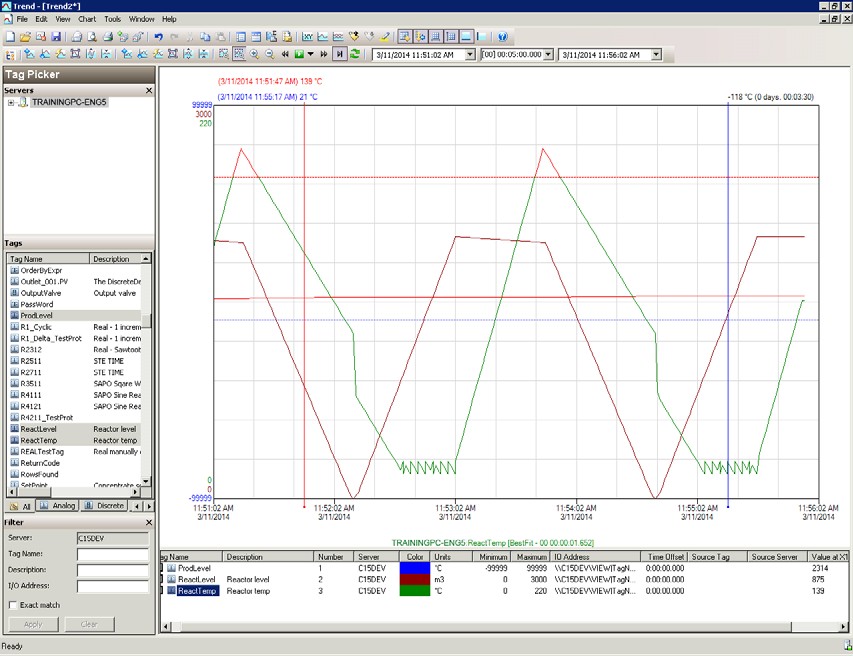
The selected tags appear on the trend and the selected tag names appear in the Tag list under the trend chart.
Step 9. On the Scaling toolbar, click Auto scale all tags to rescale the trend chart.

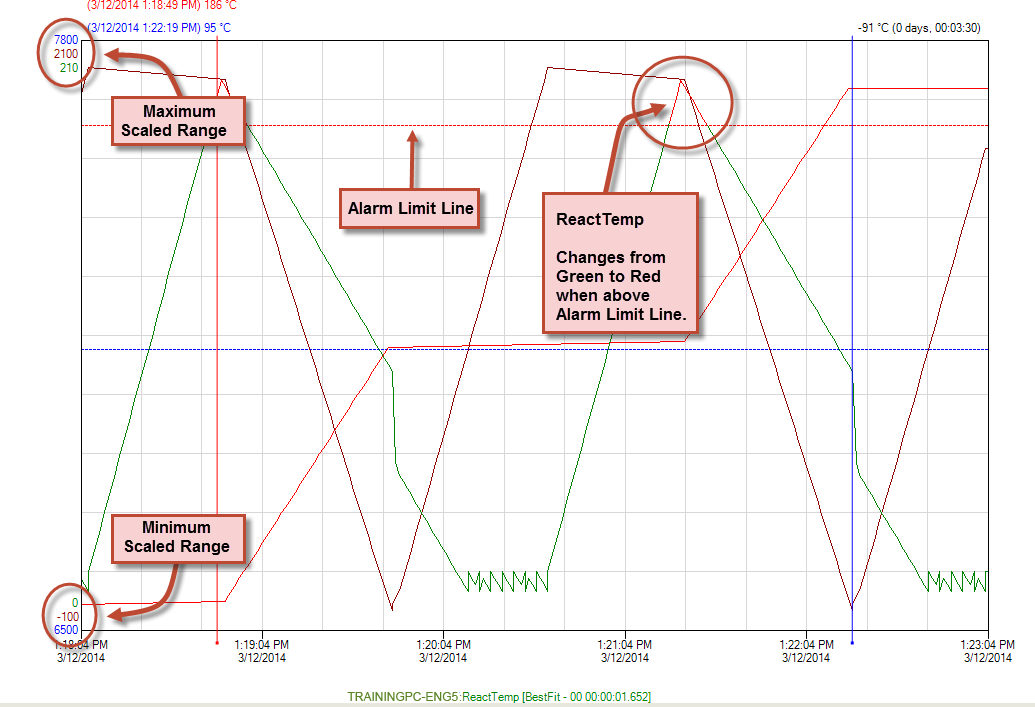
Notice several important aspects of Wonderware Historian Client Trend functionality:
- The top of the ReactTemp trace appears in red above its alarm setpoint
- The minimum and maximum scaled range for each tag is displayed on the left side of the trend chart
Manipulate a Trend
Now you will manipulate the Trend by changing the Duration, Start Time and End Time of the data displayed in your Trend.
Change the Time Range
Step 10. On the Time toolbar, in the Duration drop-down list, click 10 minutes.
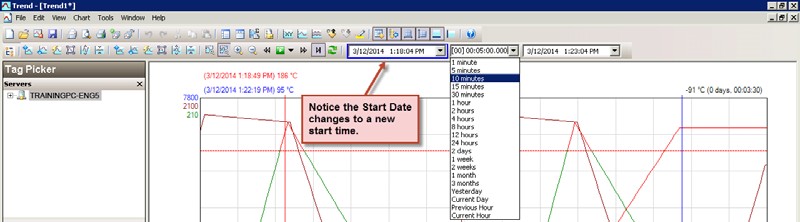
The trend chart changes to display the time span selected.
Note:A blue halo displays around the Start Date field indicating the field is automatically updated based on the time span selection.
Assign Exact Start and End Times
Step 11. On the Time toolbar, in the Start Date field, click the drop-down arrow to display the calendar.
Step 12. Select a date to begin the trend range.
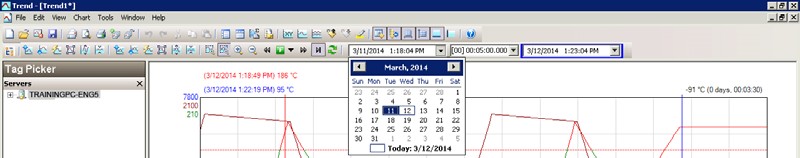
Step 13. Press Enter.
Step 14. In the End Date field, select a date.
Notice that because you selected specific start and end times, the current time mode is now disabled.
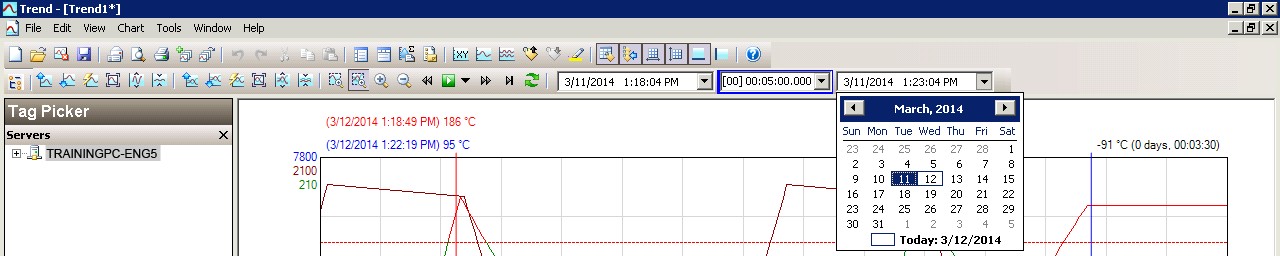
Step 15. Press Enter.
Step 16. In the Duration drop-down list, set the chart duration back to 10 minutes.
Step 17. Click Enable or disable current time mode to bring the chart back to the current time.

Last modified: Thursday, 4 July 2019, 1:53 PM